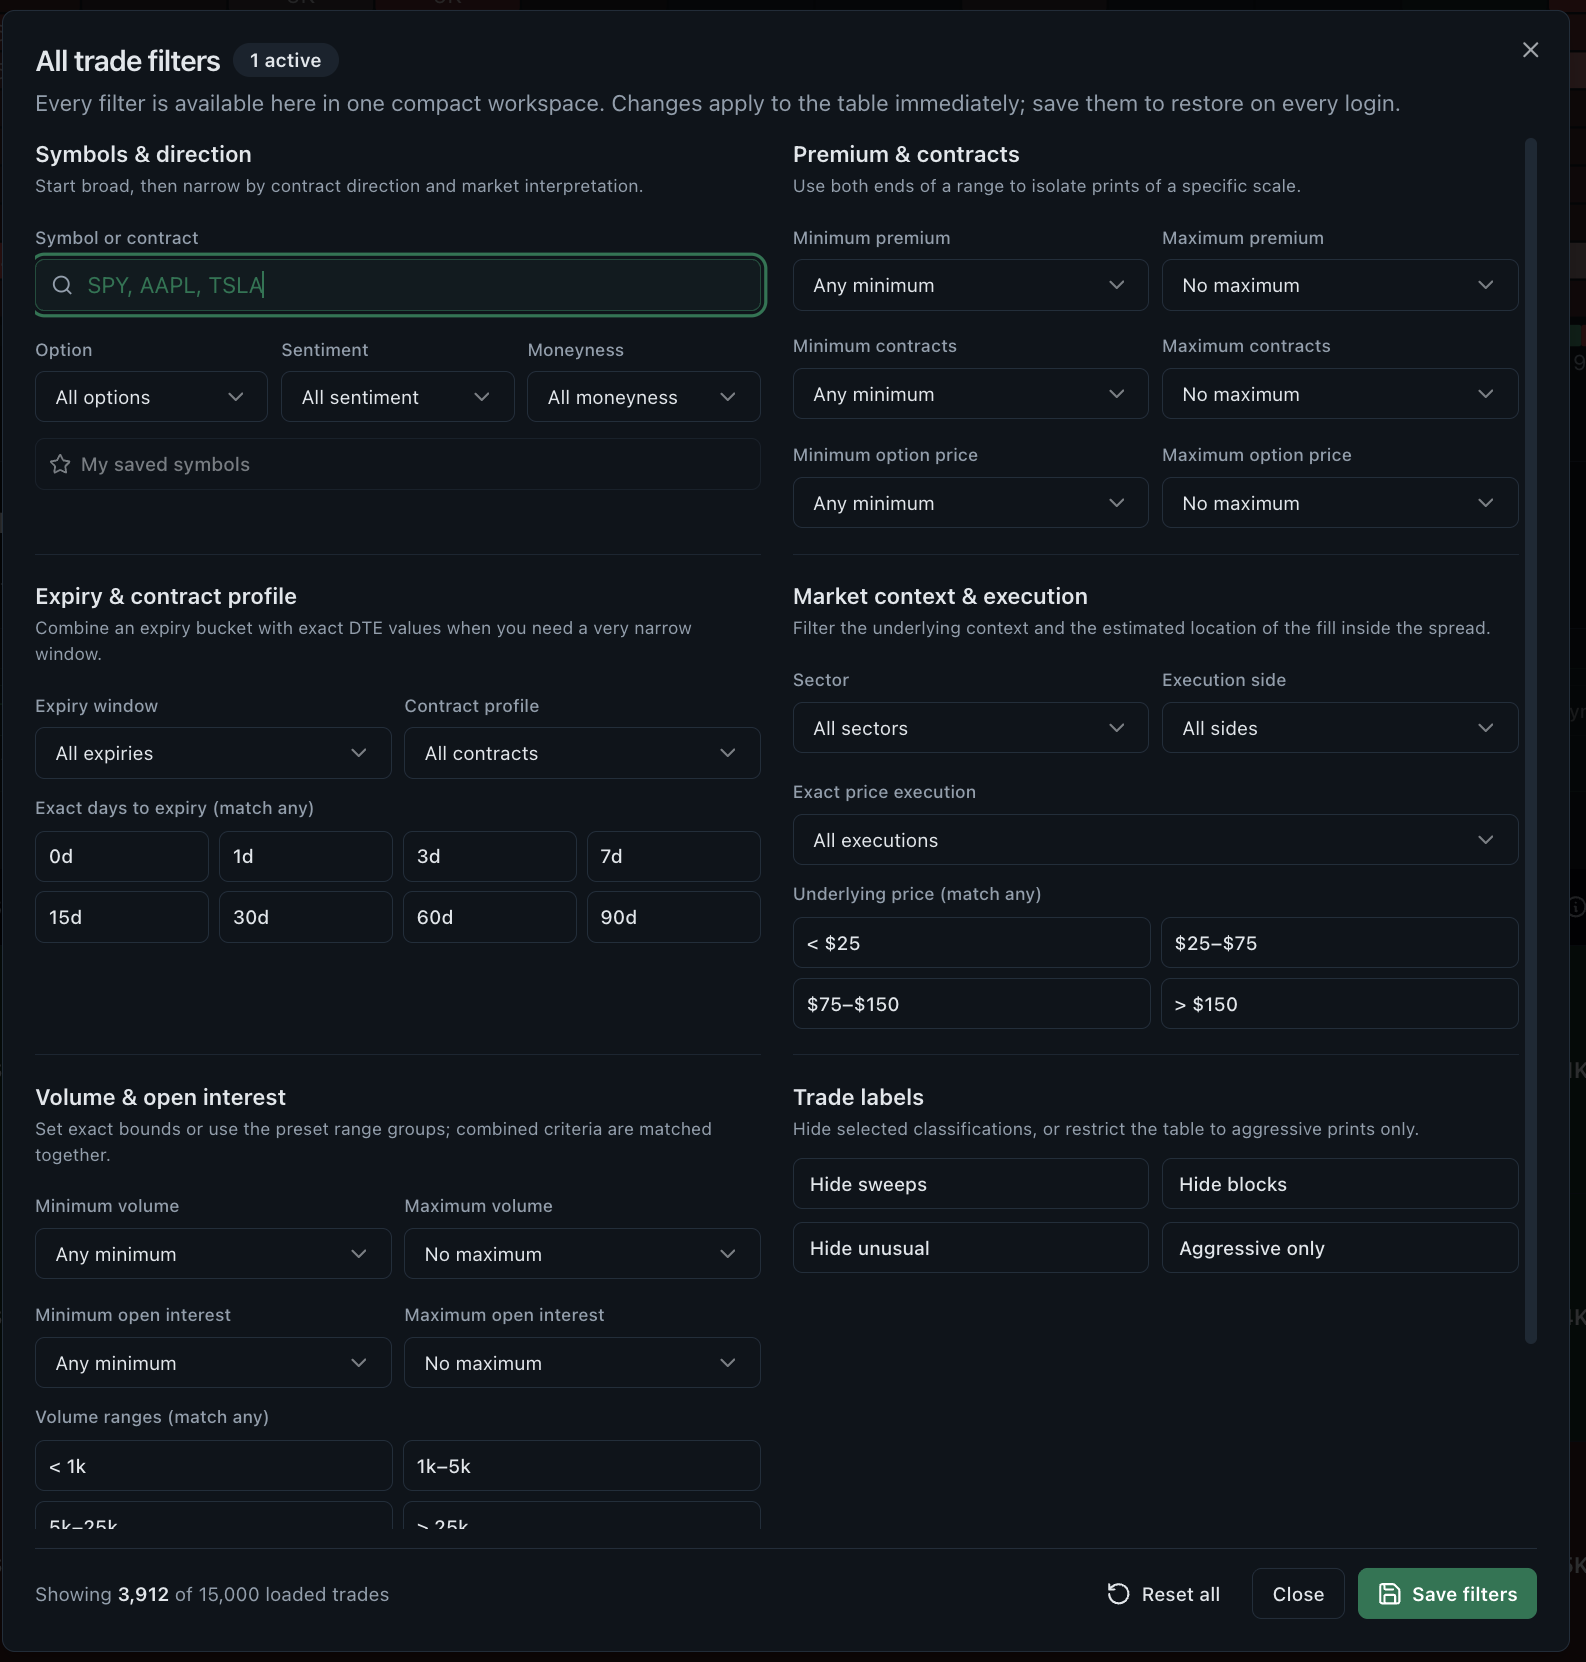
Options flow analytics for independent research

    Near Real time options flow, 0DTE GEX and option chain data

    Near real-time on Pro, 15-minute delayed on the free trial. Connect call and put pressure with unusual activity, open interest, option-chain context and market news across 10 research dashboards.

    • No credit card to start
    • $25 per month after the trial
    • Cancel anytime

    7-day trial

    All 10 dashboards with real market data on a 15-minute delay.

    Pro · $25/month

    Near-real-time data, history, notifications and priority support.

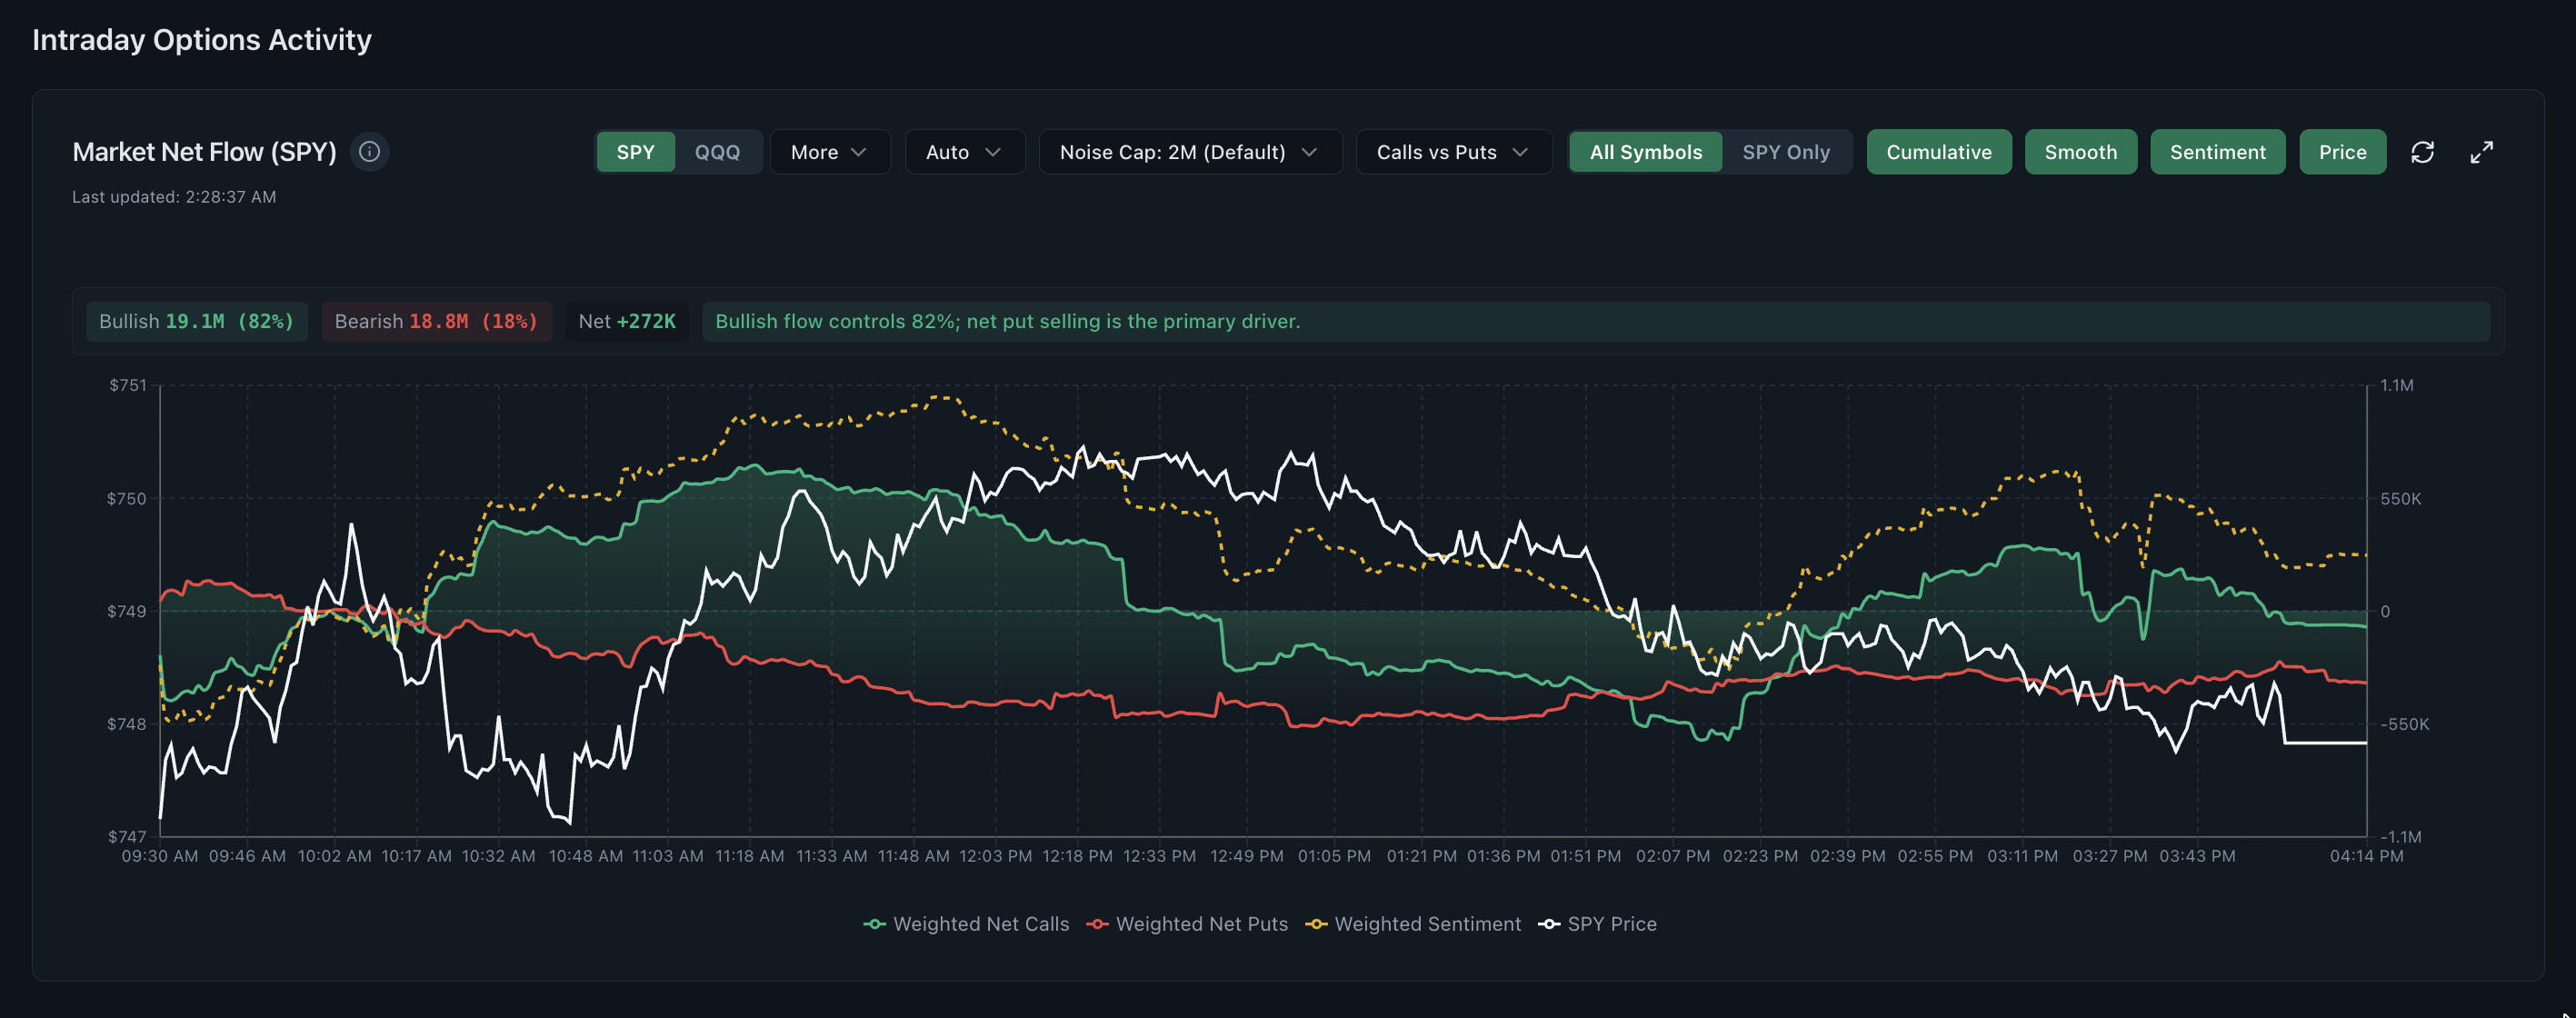
    Realtime Options weighted net flow dashboard showing call and put pressure beside SPY price
    Actual weighted net flow dashboard. Trial users see this same screen with 15-minute delayed data.

    Coverage spans thousands of US-listed stocks and ETFs with active options contracts, including SPY and QQQ options.

    10
    Research dashboardsFlow, Greeks, heat grids, 0DTE, open interest and news.
    Thousands
    US stocks and ETFsUS-listed names with active options contracts, including SPY and QQQ.
    7 days
    Free trialFull platform on a 15-minute delay. No card required.
    $25
    Per month after trialOne plan. No tiers, no add-ons, cancel anytime.

    See the options trading dashboard before you sign up

    Every image below is a screenshot of the actual platform, not a mockup. Switch between the views to see how real time options data is presented, from market-wide flow down to a single contract.

    Weighted net flow chart showing real time options flow for calls and puts against SPY price

    Real time options flow next to price

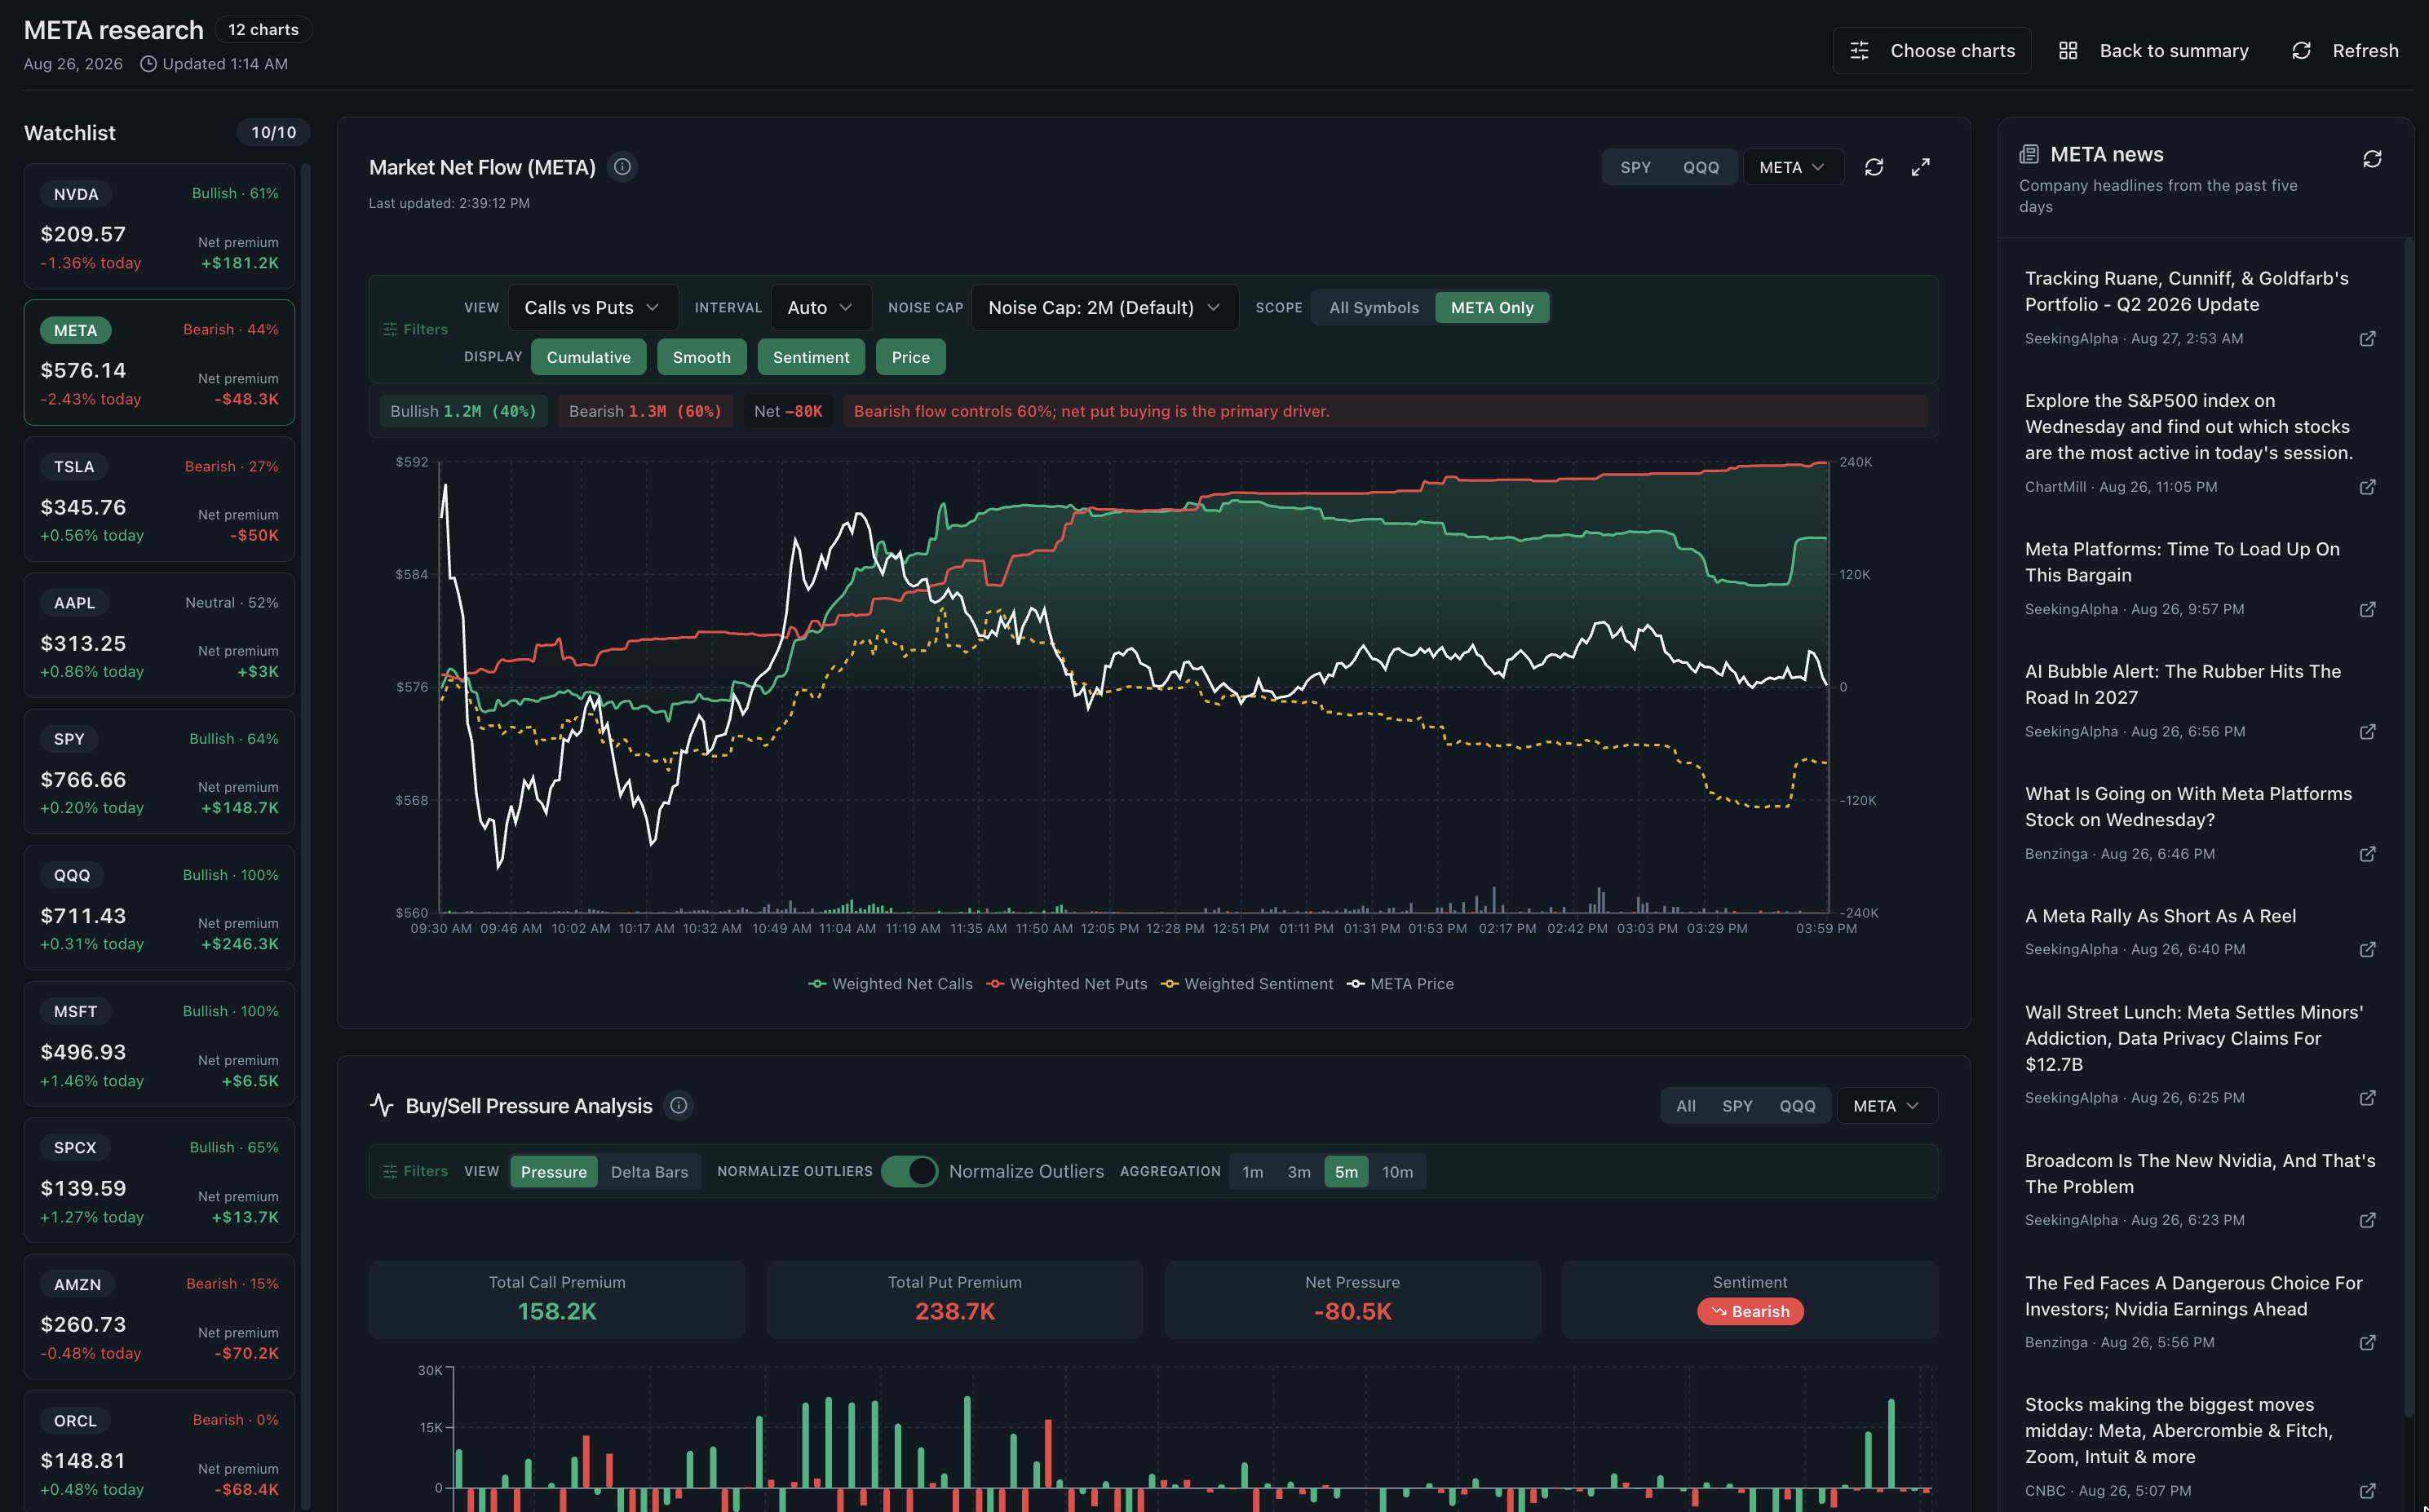
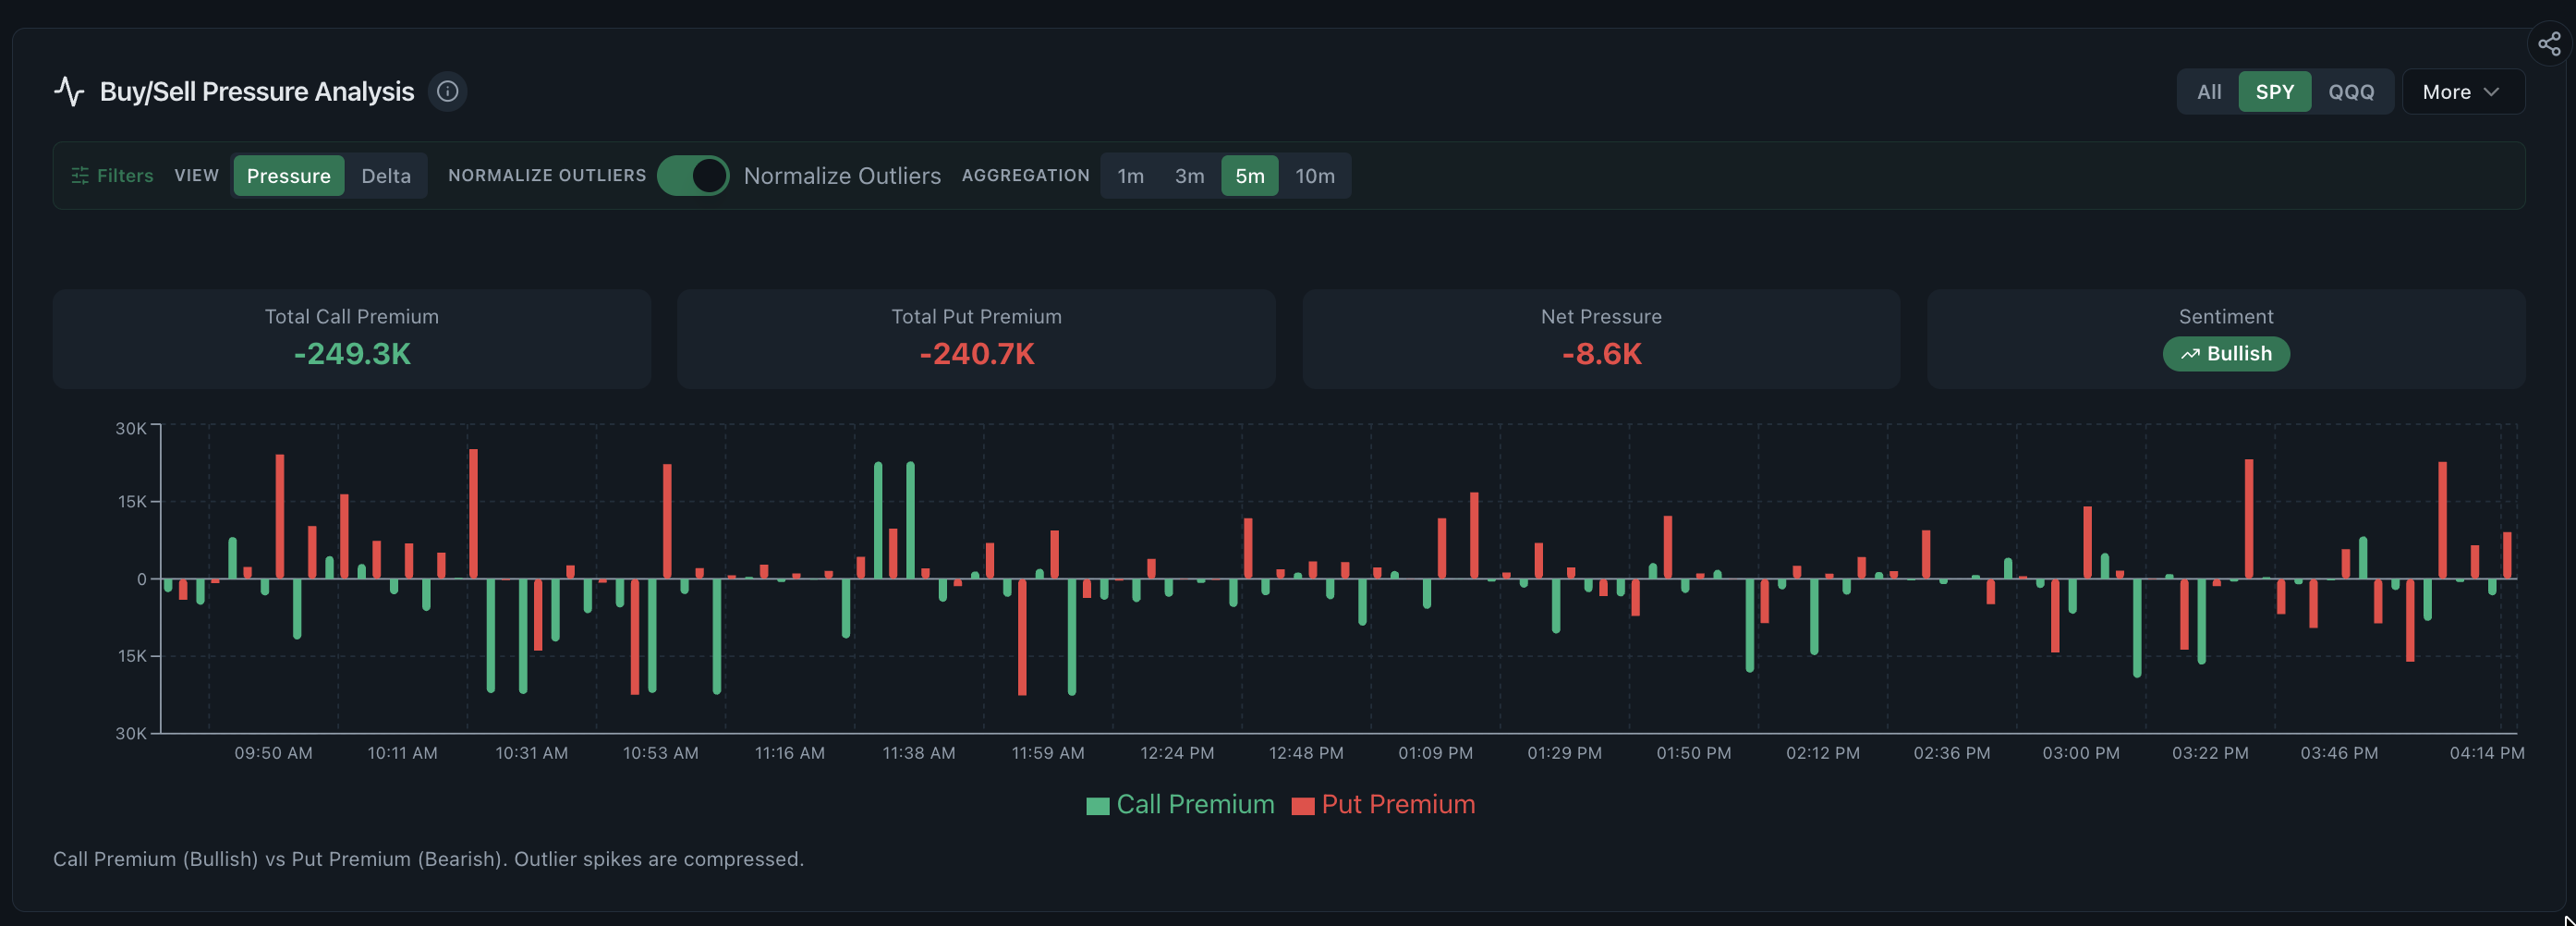
    The weighted net flow chart puts call pressure, put pressure, sentiment and the underlying price on one intraday view, so you can tell whether options flow is confirming the move or fading it.

    • Call and put premium weighted by aggressiveness
    • Sentiment line and price on the same time axis
    • Session view rebuilt continuously through the day
    Premium heat grid showing option chain data by strike and expiry with call and put exposure

    Option chain data by strike and expiry

    The premium heat grid reads like an option chain you can scan at a glance. Switch between premium, gamma exposure and vanna exposure to see which strike and expiry is carrying the position risk.

    • Strike by expiry grid from 0DTE out to later cycles
    • Premium, GEX and VEX modes on the same layout
    • Call side and put side split for real time put activity
    Flow map beside Greeks by strike for SPY showing gamma, vanna and charm controls

    Where flow is building, strike by strike

    The flow map ranks bullish and bearish tickers side by side with gamma, vanna and charm by strike, which is how you move from a market-wide read to the two or three names worth a closer look.

    • Bullish and bearish ticker tiles ranked by net premium
    • Gamma, vanna and charm plotted per strike
    • Filters for ETFs, single names and index products
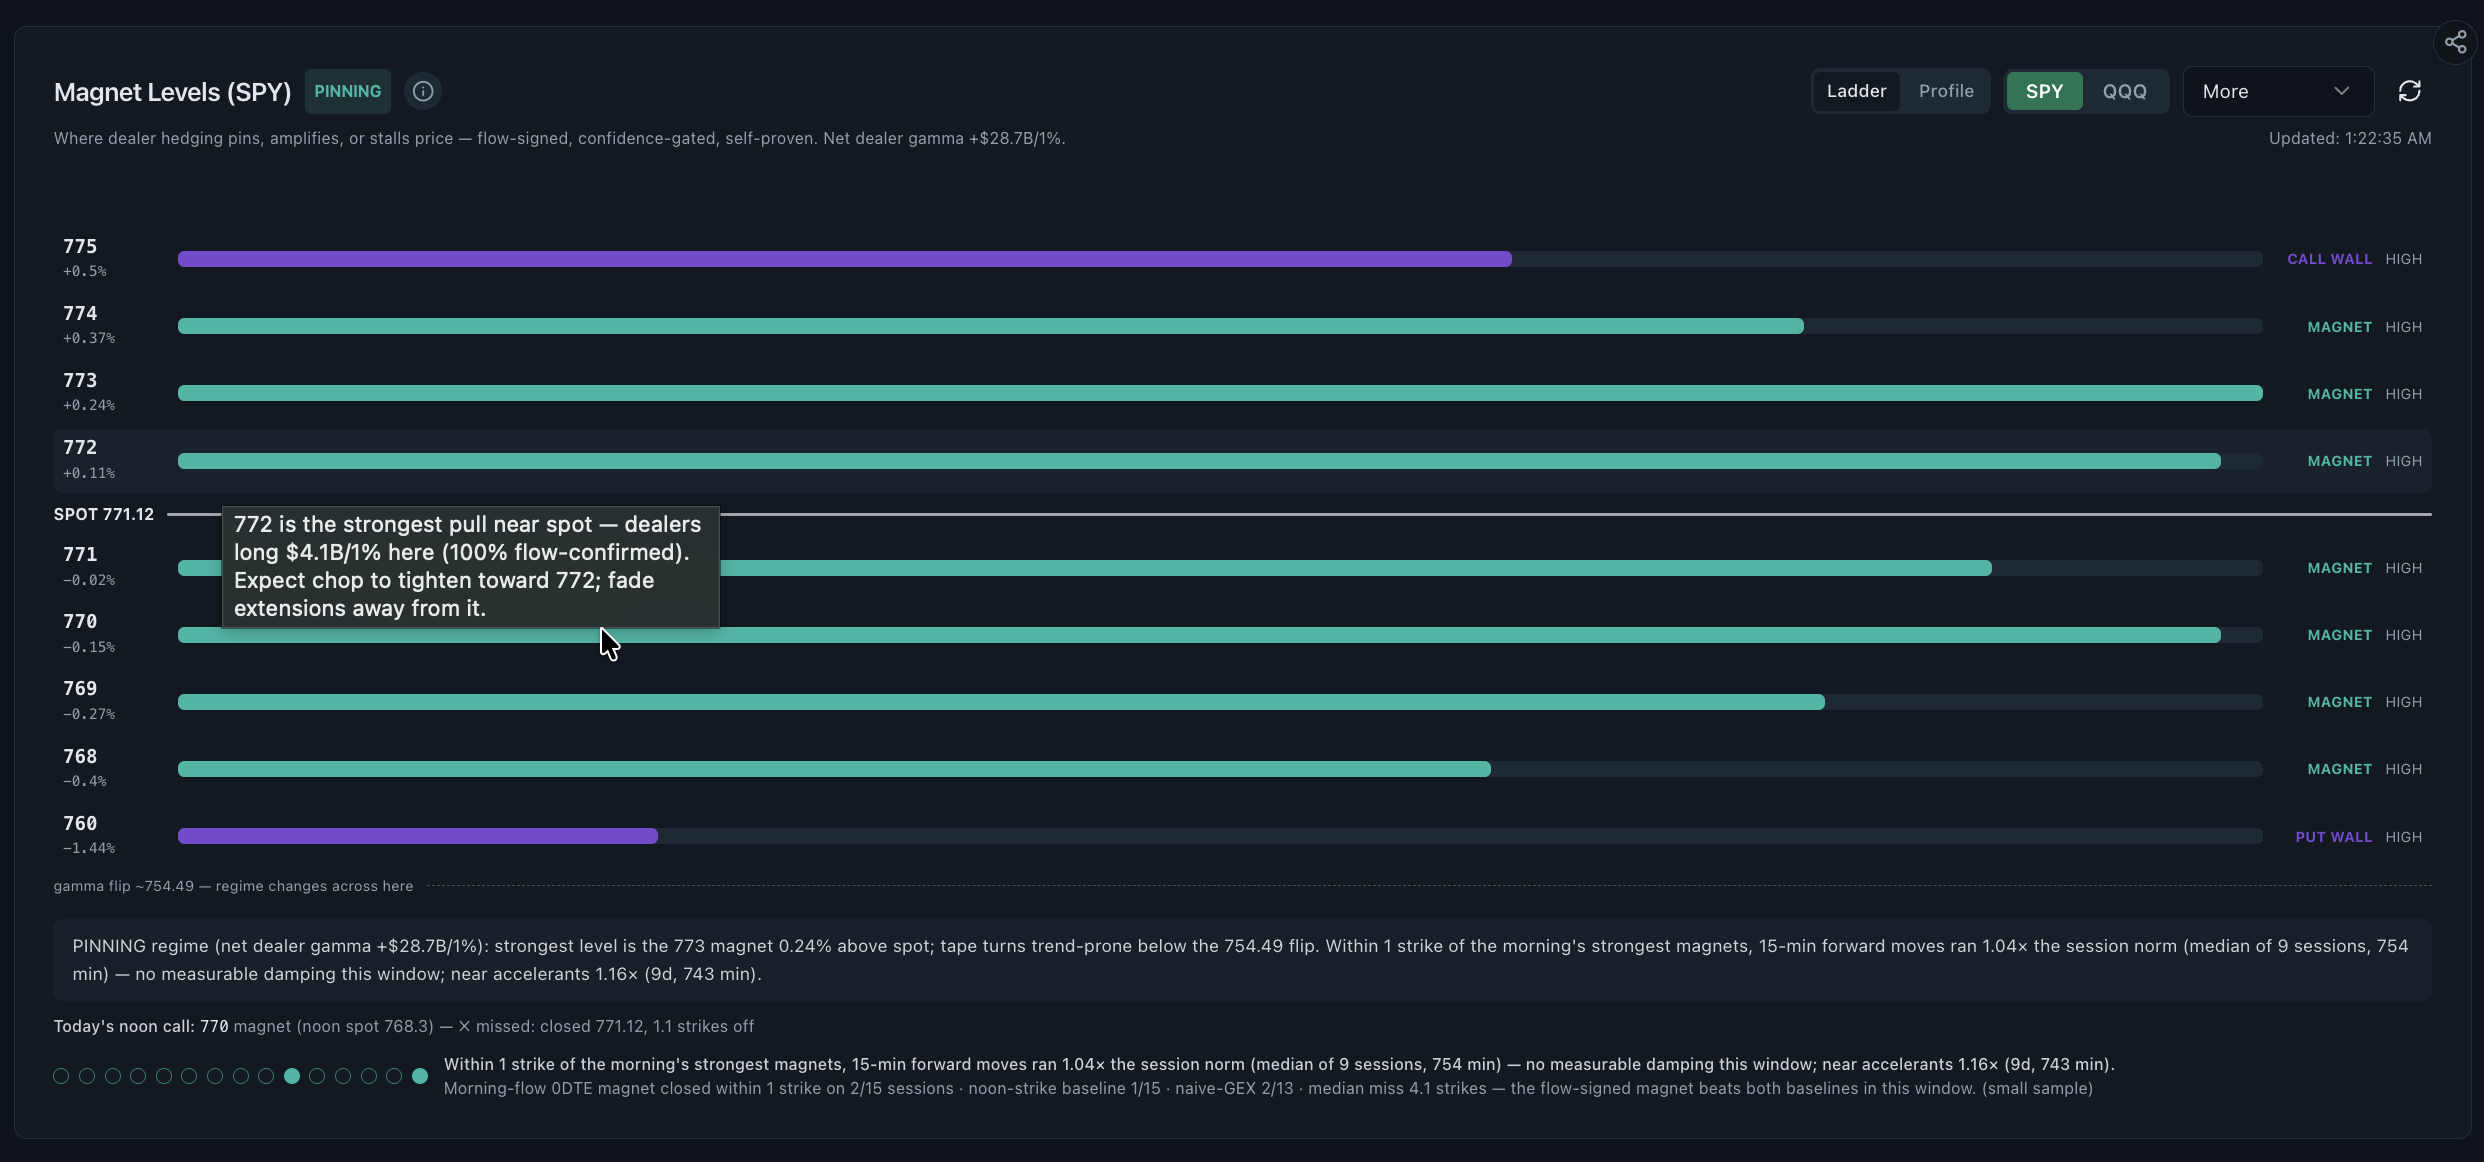
    0DTE and GEX chart showing scaled gamma exposure around SPY strike levels

    0DTE gamma exposure around current price

    Same-day contracts move fast and hedging flows move with them. The 0DTE view plots scaled gamma exposure around spot so you can mark the strikes that tend to act as magnets or pivots.

    • Max GEX strike called out directly on the chart
    • Scaled and raw exposure views
    • Focused on same-day expiries during the session
    Whales positioning view with ask, mid and bid premium plus volume, open interest and price

    Options quotes context on a single contract

    Open any large print to see ask-side, mid and bid-side premium over time next to price, volume, open interest and trade count. This is the closest the platform gets to a quote view, and it is contract level rather than a raw exchange feed.

    • Ask, mid and bid premium plotted through the session
    • Volume, open interest and trade count on the same panel
    • 1-day, 3-day and 5-day windows
    Market news page filtered to SPY headlines with search and category controls

    The catalyst behind the flow

    Flow without context is guesswork. The news view filters headlines by ticker and category so an unusual print can be checked against an earnings date, a downgrade or a macro release before you act on it.

    • Headlines filtered to the ticker you are researching
    • Search across sources and categories
    • Timestamps aligned with the trading session

    Six of the ten research dashboards are shown in this tour. Read the breakdown of the other four tools further down this page, or check what the free trial includes.

    Straight answers about real time options data

    These are the questions people ask before paying for an options data platform, answered plainly, including the things this platform does not do.

    What is real time options data?

    Real time options data is the stream of trades, quotes, volume and open interest generated by listed options contracts as they change hands. Realtime Options delivers this as near real-time analytics: continuously updated through the session with minimal latency, derived from licensed third-party market data rather than a direct exchange feed.

    Full breakdown of real time options data

    Do you provide real time options quotes?

    The platform shows contract-level quote context, not a brokerage quote screen. On any contract you can see premium at the ask, the mid and the bid over time, alongside price, volume, open interest and trade count. For order entry you still use your broker.

    What quote context covers

    Where can I see real time options flow?

    Options flow appears in four places: the weighted net flow chart for market direction, the flow map for bullish and bearish tickers, the heat grid for strike-level concentration, and the tape of individual prints. All four update continuously while US markets are open.

    How the options flow scanner works

    Is there free real time options data here?

    No. There is a 7-day free trial with full platform access on a 15-minute delay, and no credit card is required to start it. Near real-time analytics are part of the $25 per month plan. Anyone advertising genuinely free real-time US options data is usually showing delayed data.

    See what the free trial includes

    Do you offer a real time options data API?

    No. Realtime Options is dashboard software with no public options data API, so there is nothing to query programmatically. If you need raw options data in code, an exchange-licensed market data vendor is the right supplier. This platform is for visual research instead.

    What to buy instead of an API

    Can I track real time put activity?

    Yes. Put activity is tracked separately from calls throughout: put premium is plotted below the zero line on weighted net flow, the put/call ratio is charted over time, the heat grid has a dedicated put side by strike, and bearish tickers are ranked in their own column.

    Do you provide real time option chain data?

    Yes, presented as analytics rather than a raw chain. The premium heatmap and open interest views break activity down strike by strike and expiry by expiry, with gamma, vanna and charm per strike. It answers where contracts are concentrated, not what every line of the chain last printed.

    Is this a low cost platform with options flow data?

    Yes. One plan at $25 per month covers every dashboard, with no tiers, seat minimums or add-on data packages. Comparable options flow tools commonly sit between $50 and $200 per month. Billing is monthly and can be cancelled at any time.

    How options flow providers compare

    Which service provides real-time F&O trading signals and insights?

    Not this one. Realtime Options covers US-listed equity and ETF options only, and it publishes analytics rather than trading signals. There are no buy or sell calls, no alerts telling you what to trade, and no Indian F&O coverage. You read the data and reach your own conclusions.

    Read the risk disclaimer

    More detail in the options flow and data FAQ.

    What options trading analytics should you monitor in real time?

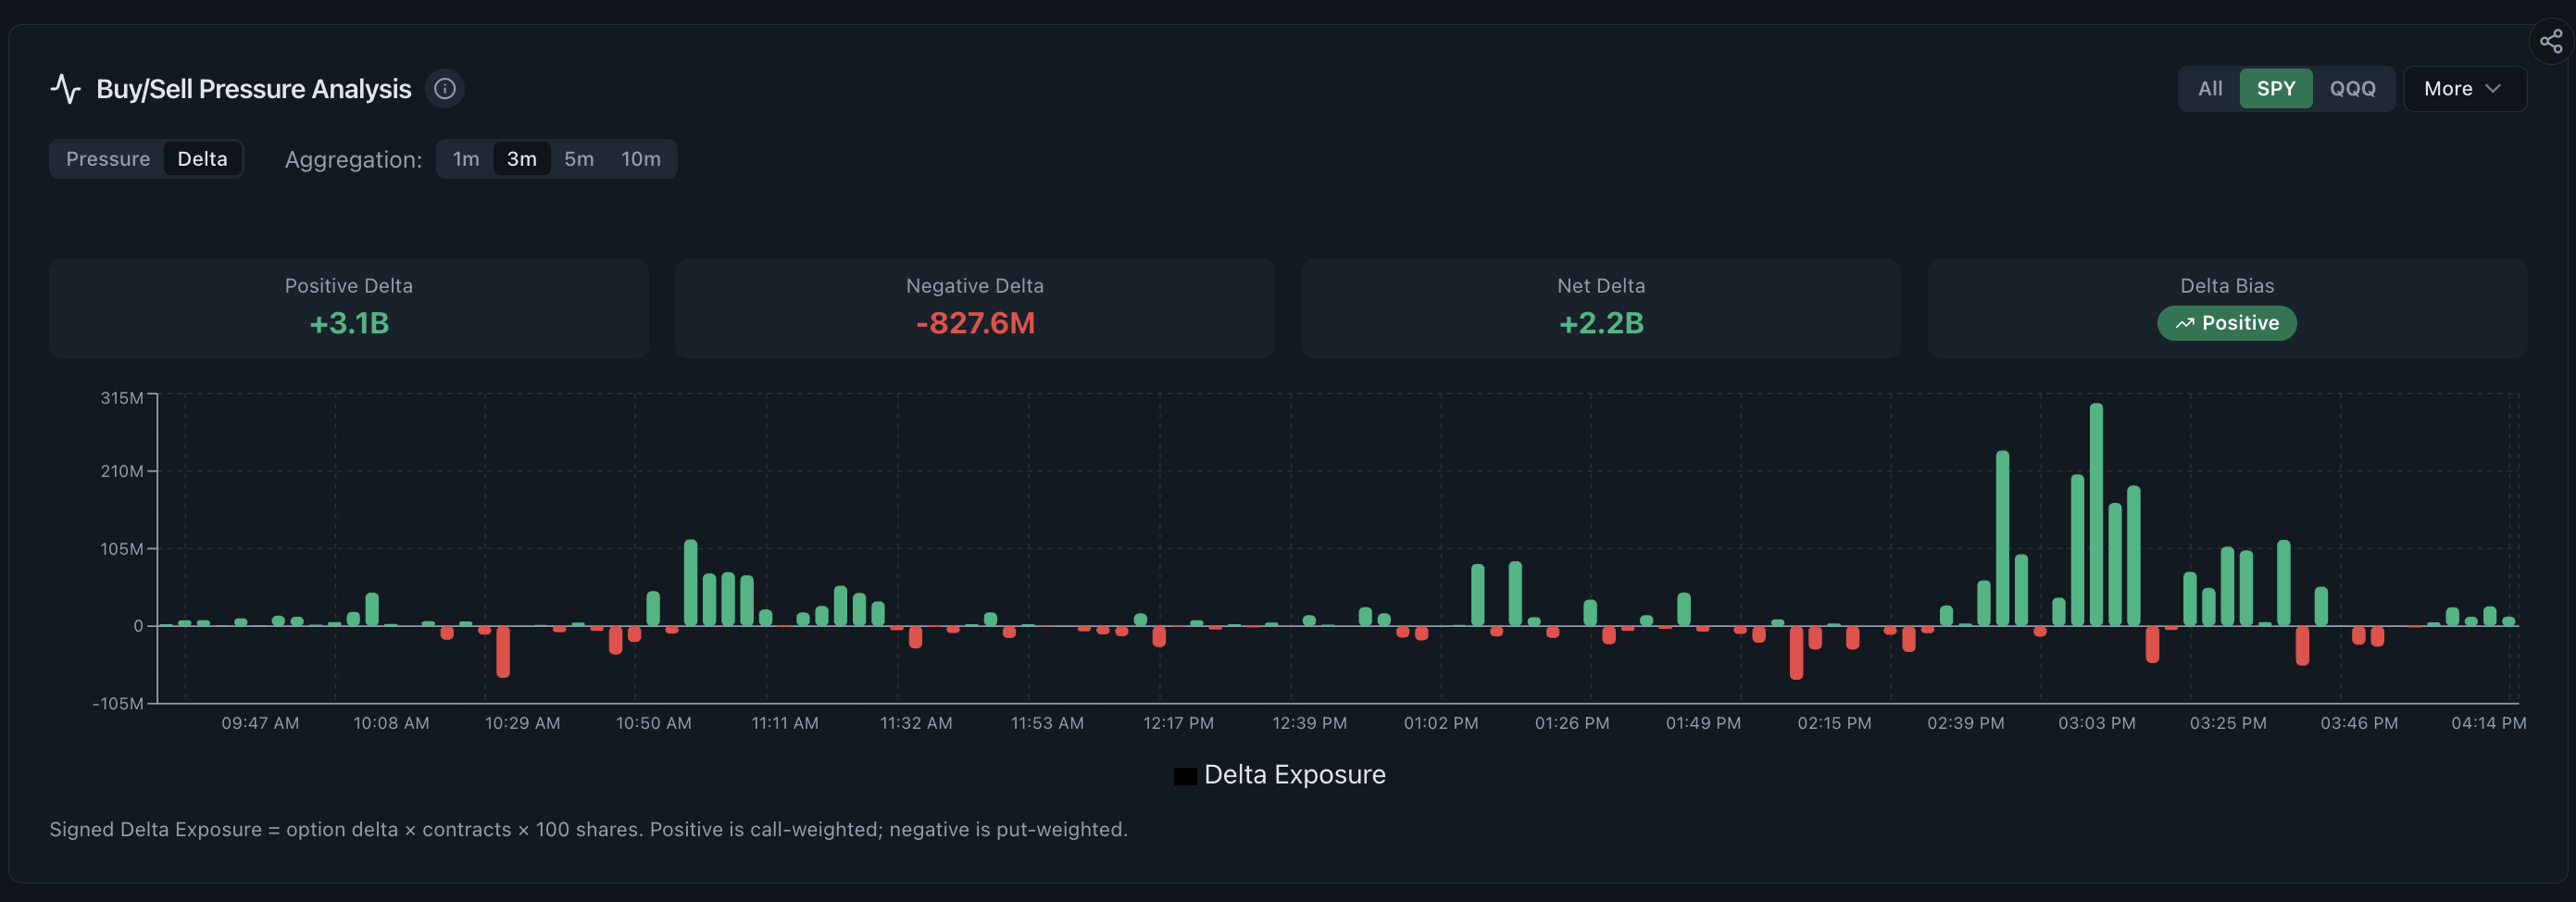
    Call versus put pressure, net premium, volume, open interest, gamma exposure, 0DTE positioning, price confirmation, sector and ticker flow, and the news behind a move. Each dashboard below answers one of those questions, and they are meant to be read together rather than one at a time.

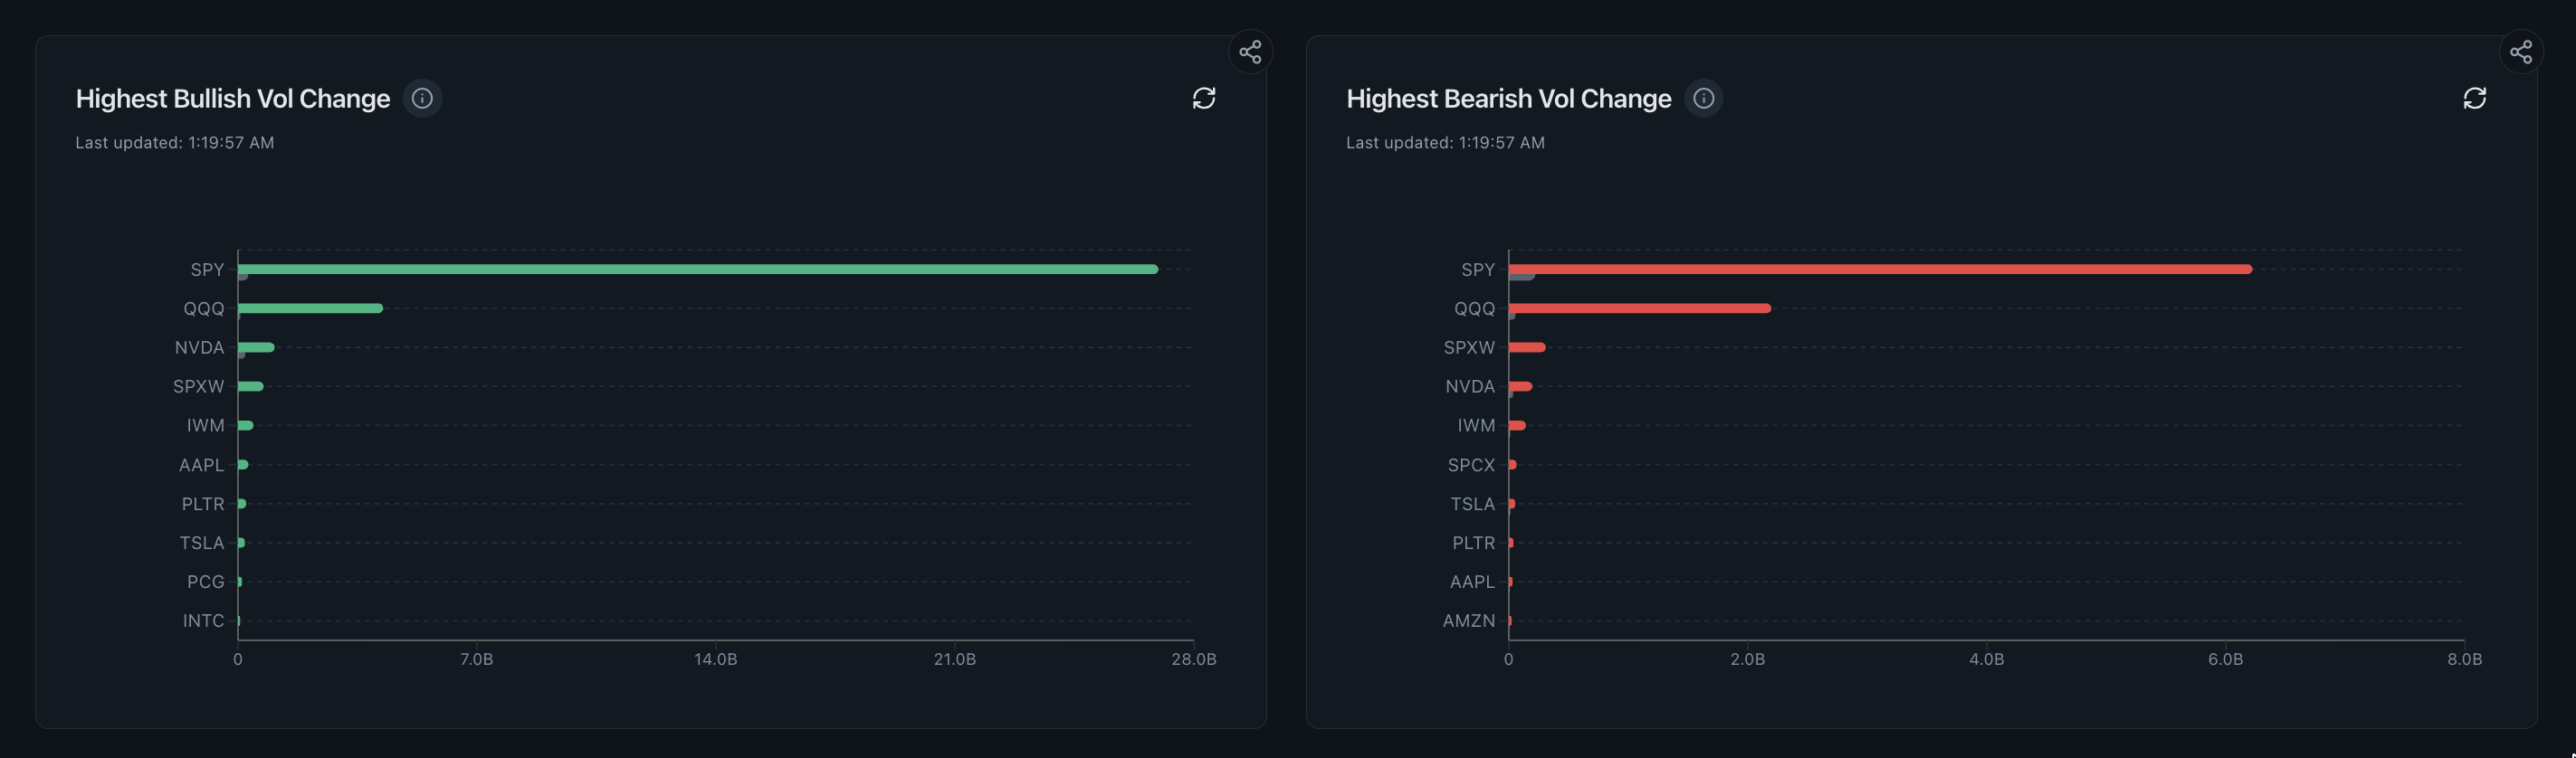
    Sector flow and top ticker flow bar charts ranking bullish and bearish options premium

    Sector and ticker flow

    Which sectors and names are absorbing the attention?

    Start from market-wide flow and drill into the sectors and single names where options premium is actually clustering, so a watchlist reflects today's activity instead of last week's.

    • Sector breadth in one bar chart
    • Top tickers ranked by net premium
    • Bullish and bearish sides split
    Algo flow chart with call volume, put volume and price beside top bullish and bearish tickers

    Algo flow and top tickers

    Which names deserve attention right now?

    Call and put volume bursts sit beside a ranked list of the most active bullish and bearish tickers, which is the fastest way to decide what to research first in a busy session.

    • Call and put volume through the session
    • Price overlay for confirmation
    • Ranked bullish and bearish lists
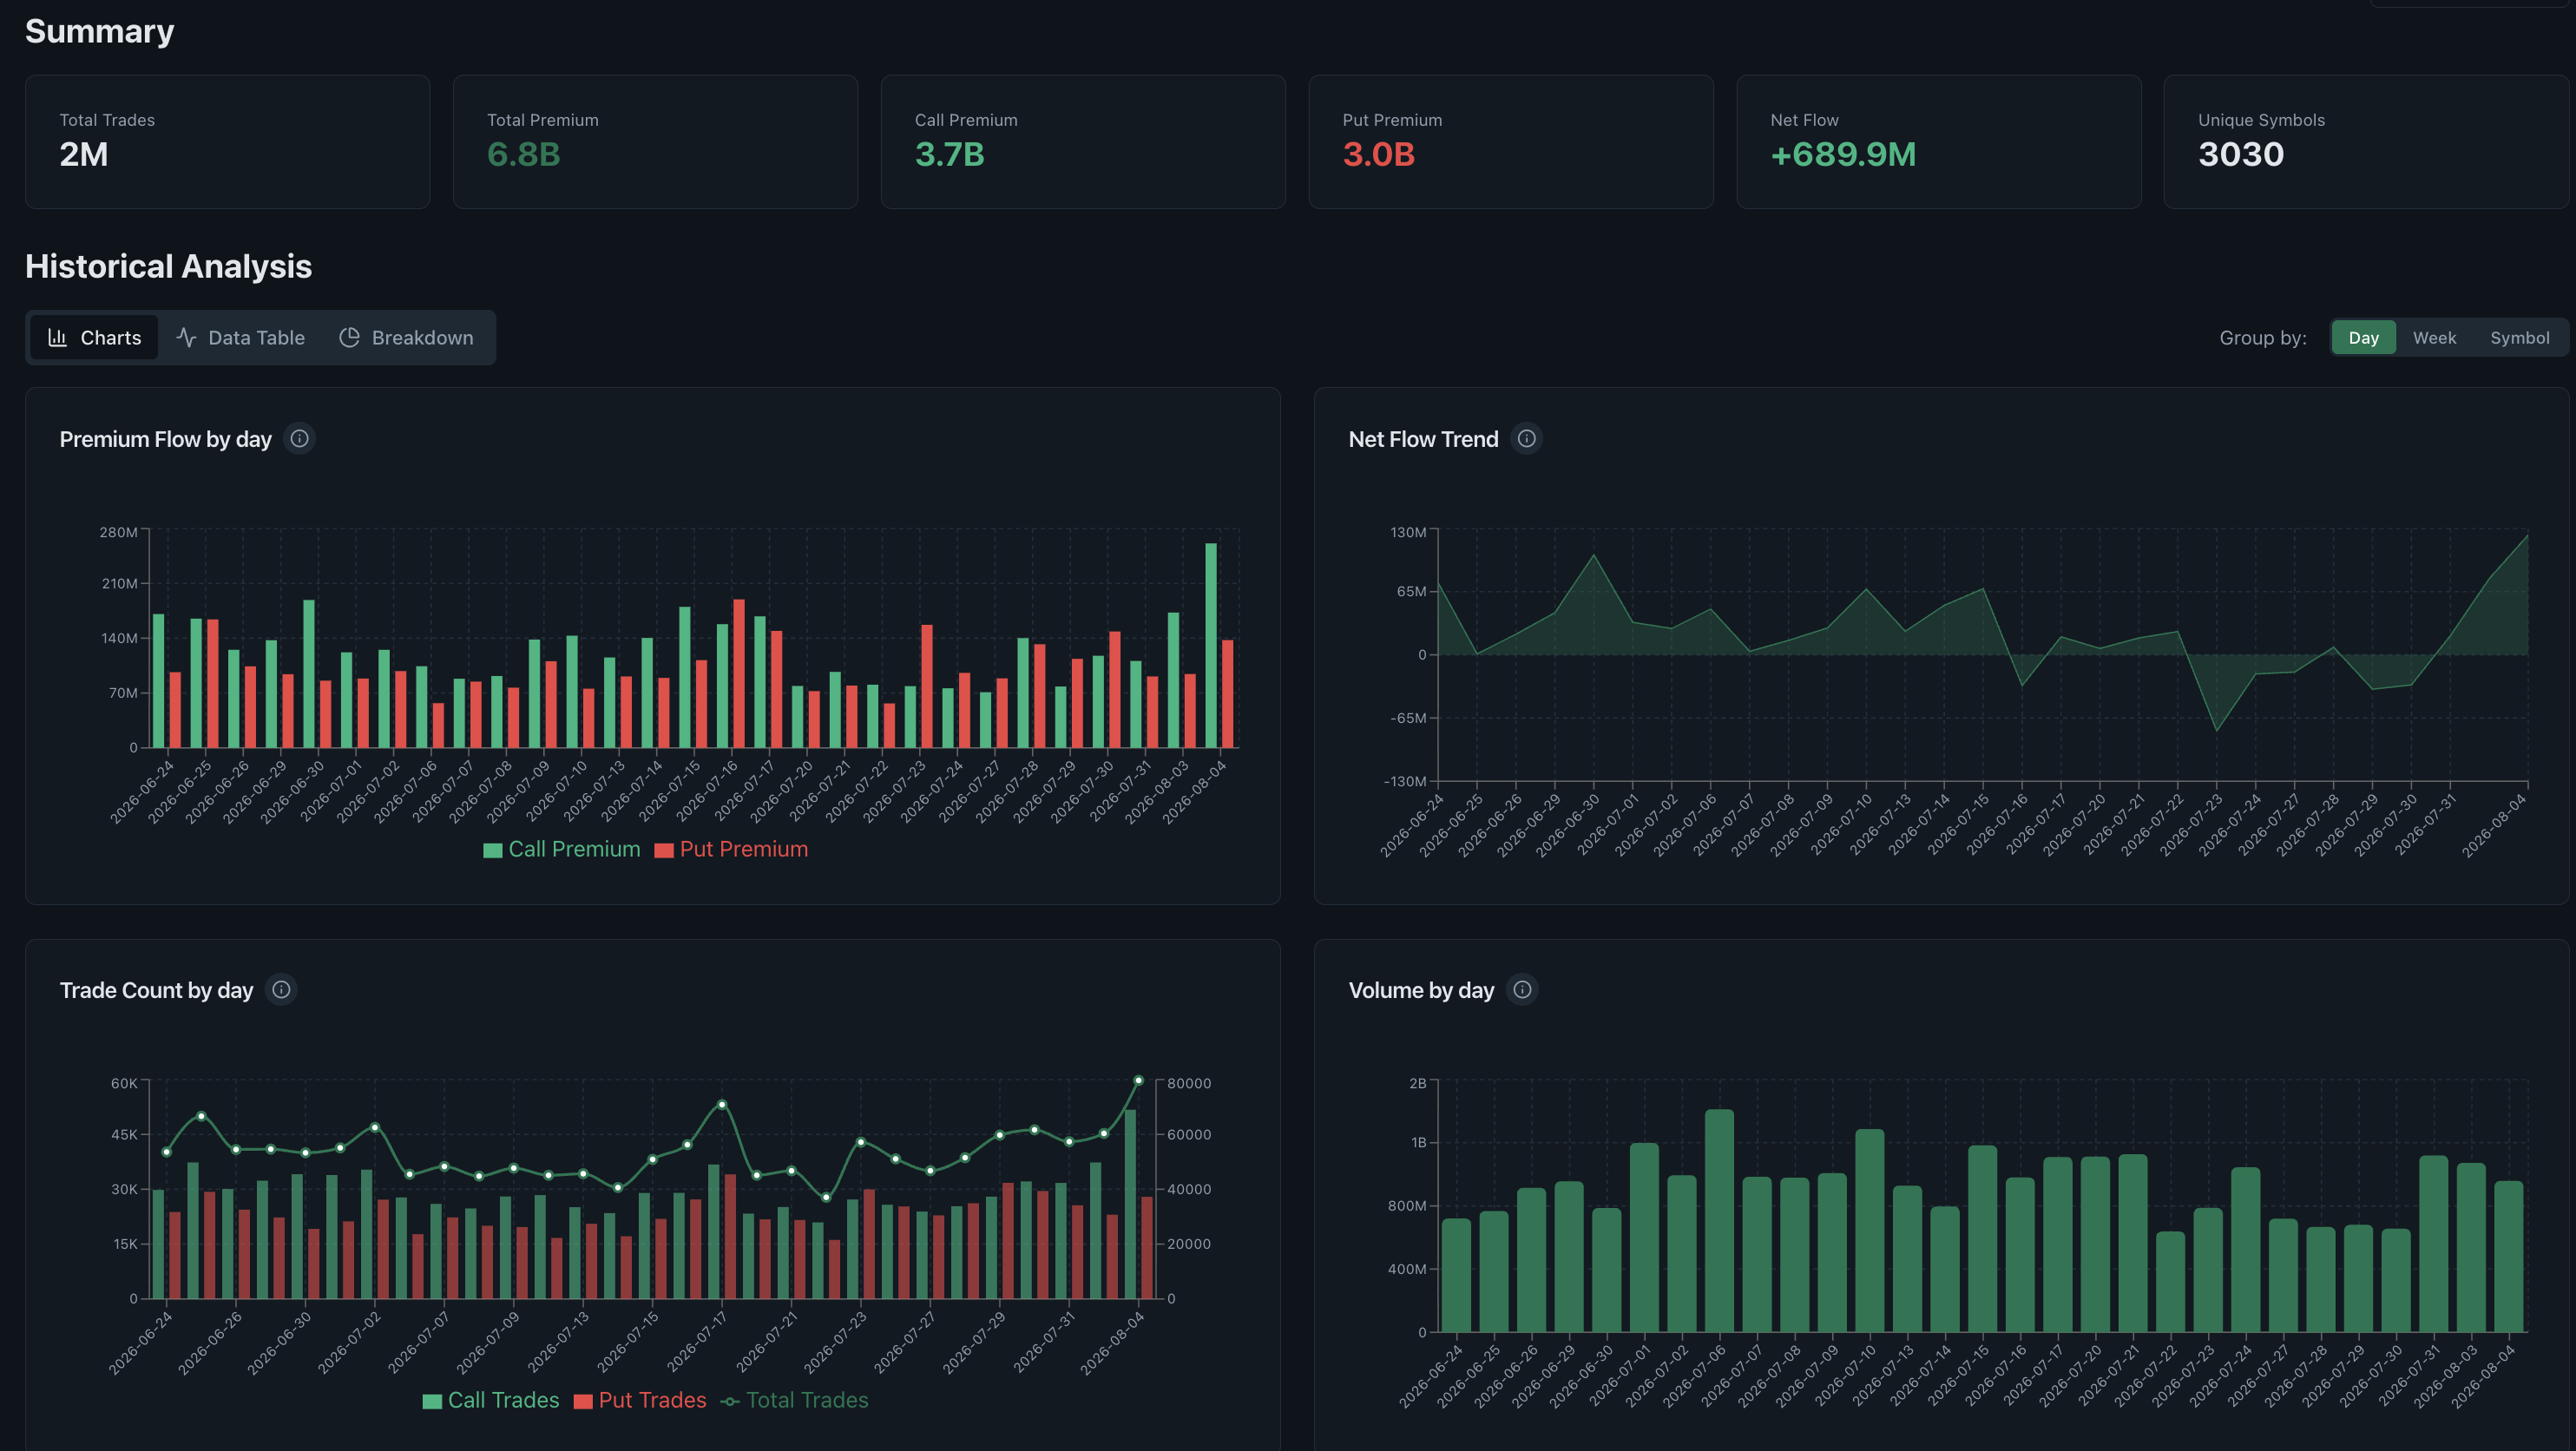
    Flow trend dashboard showing total premium, volume, put call ratio and trade count over time

    Flow trend dashboard

    Is today part of a broader trend, or a one-off?

    Total premium, volume, put/call ratio and trade count are tracked over time, so a big day can be judged against the weeks around it rather than read in isolation.

    • Premium and volume trends
    • Put/call ratio history
    • Trade count and call ratio
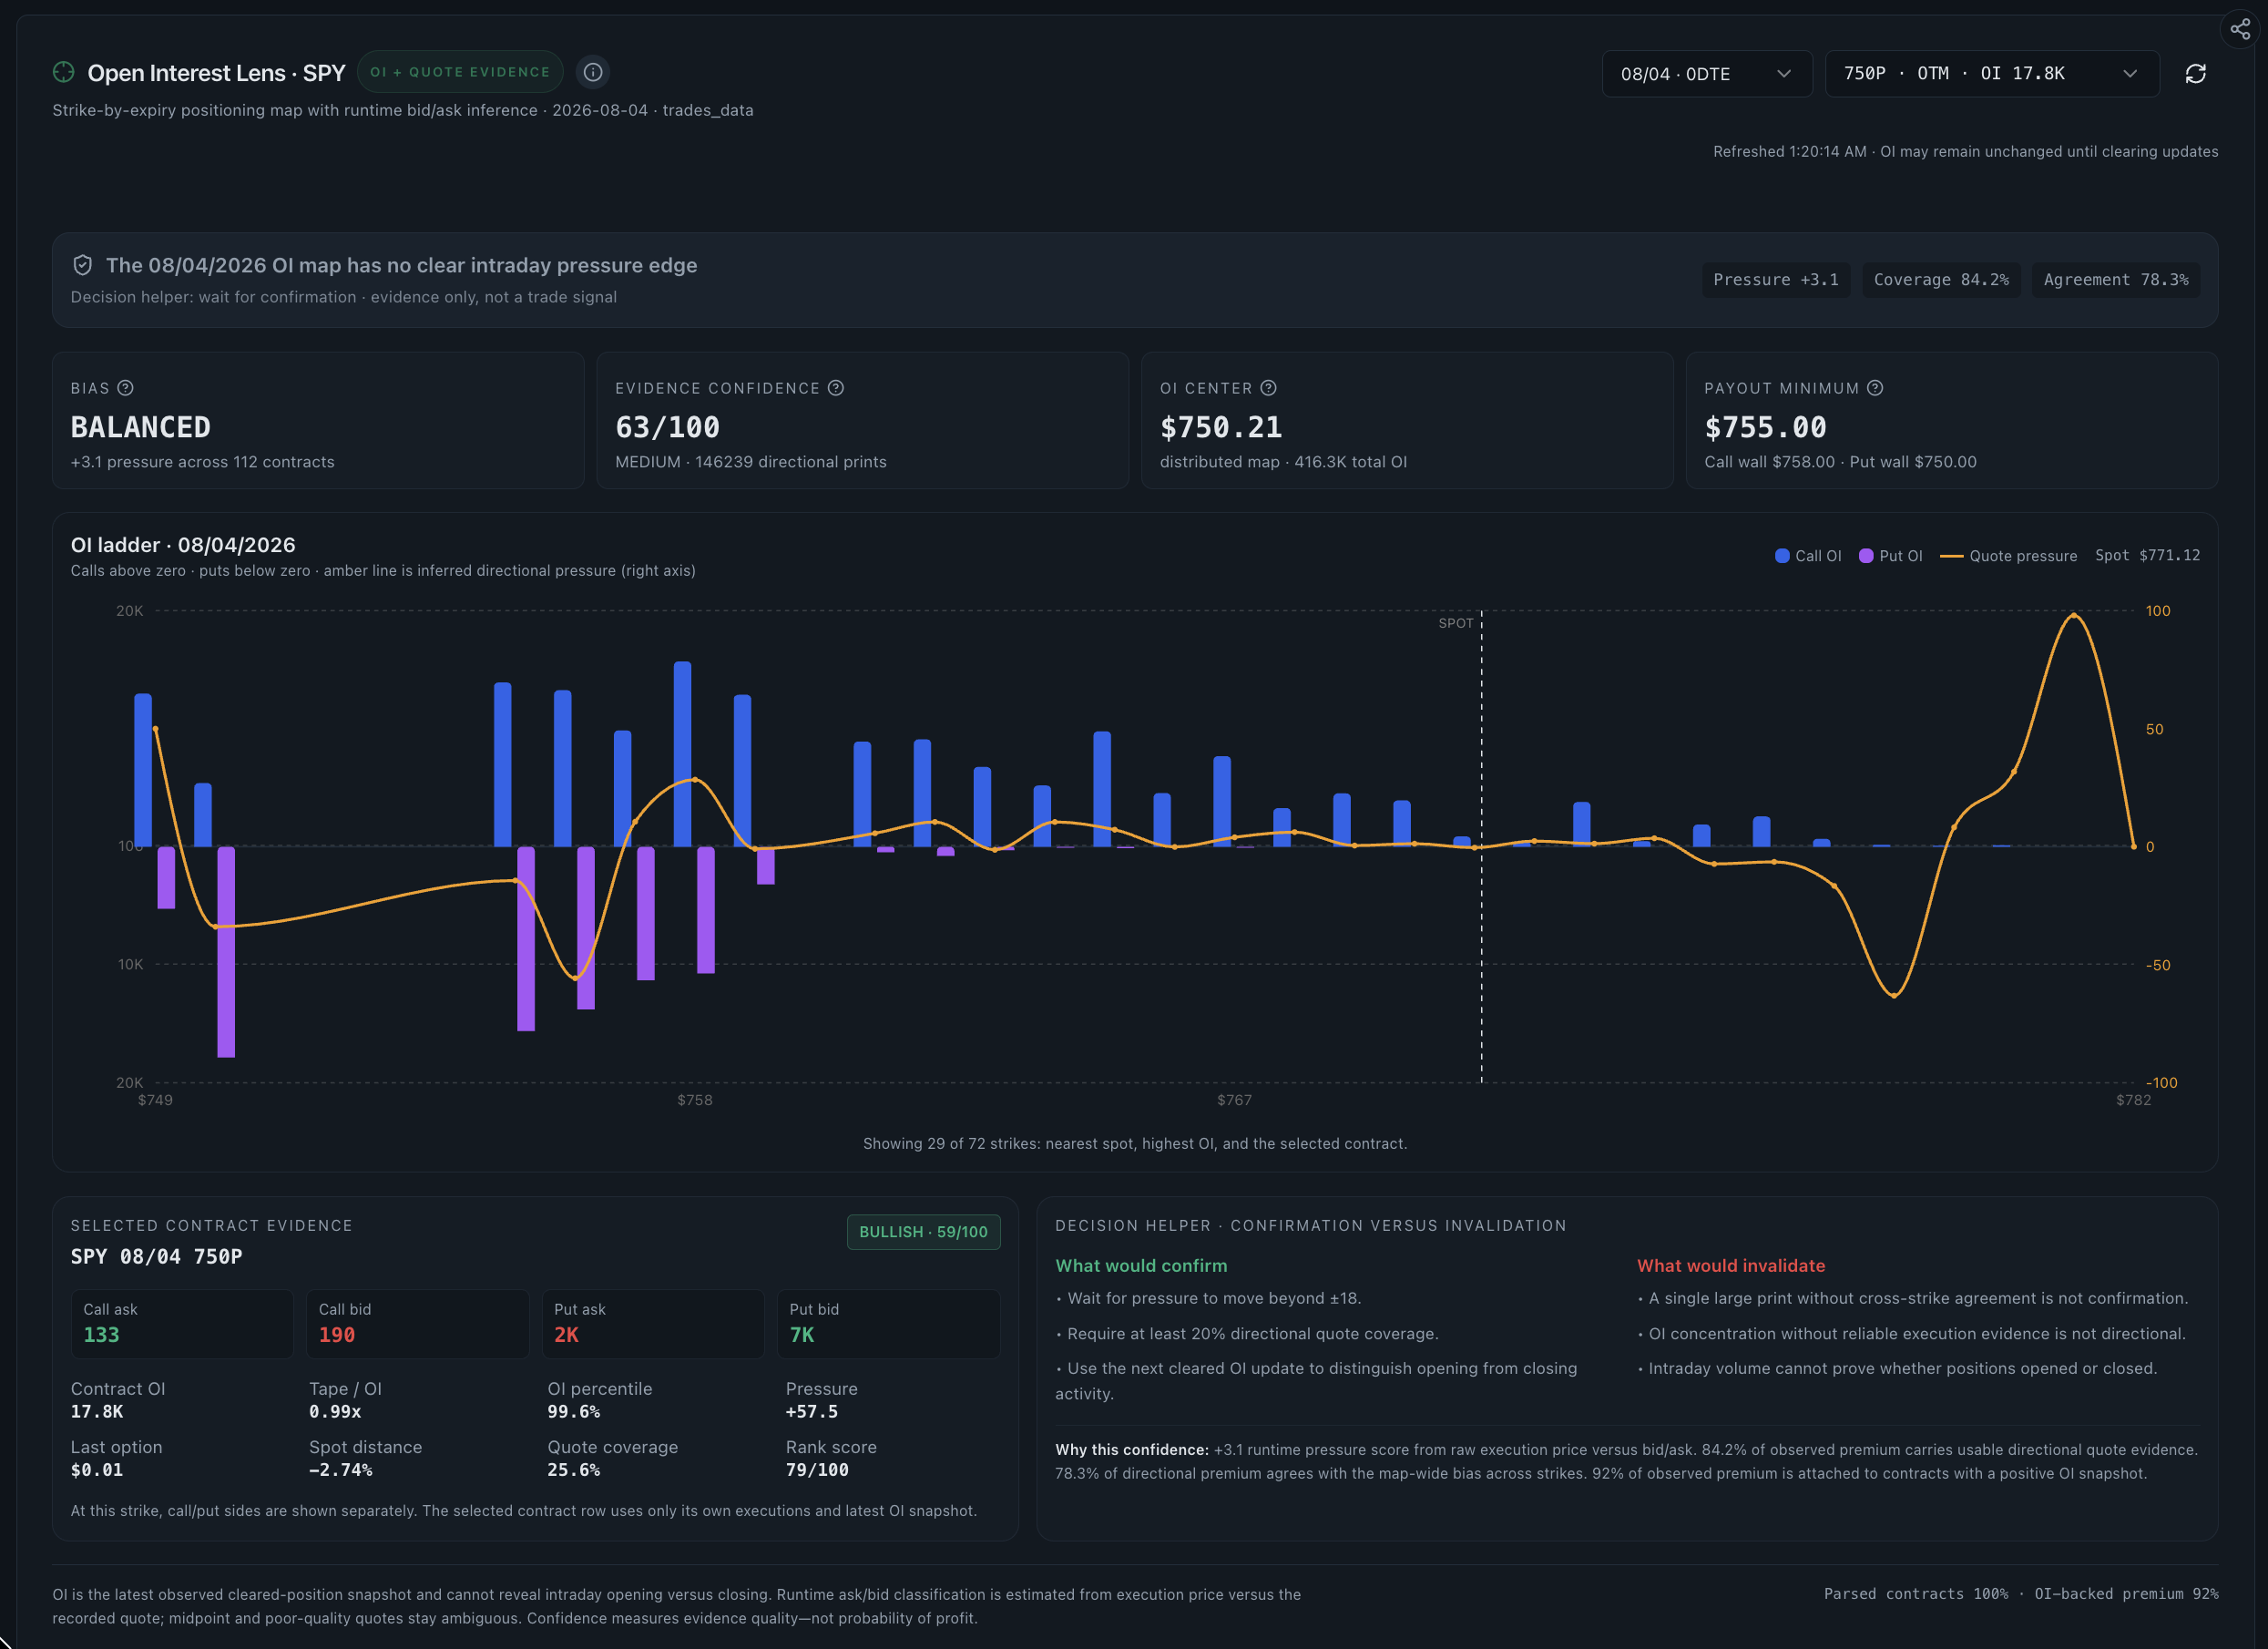
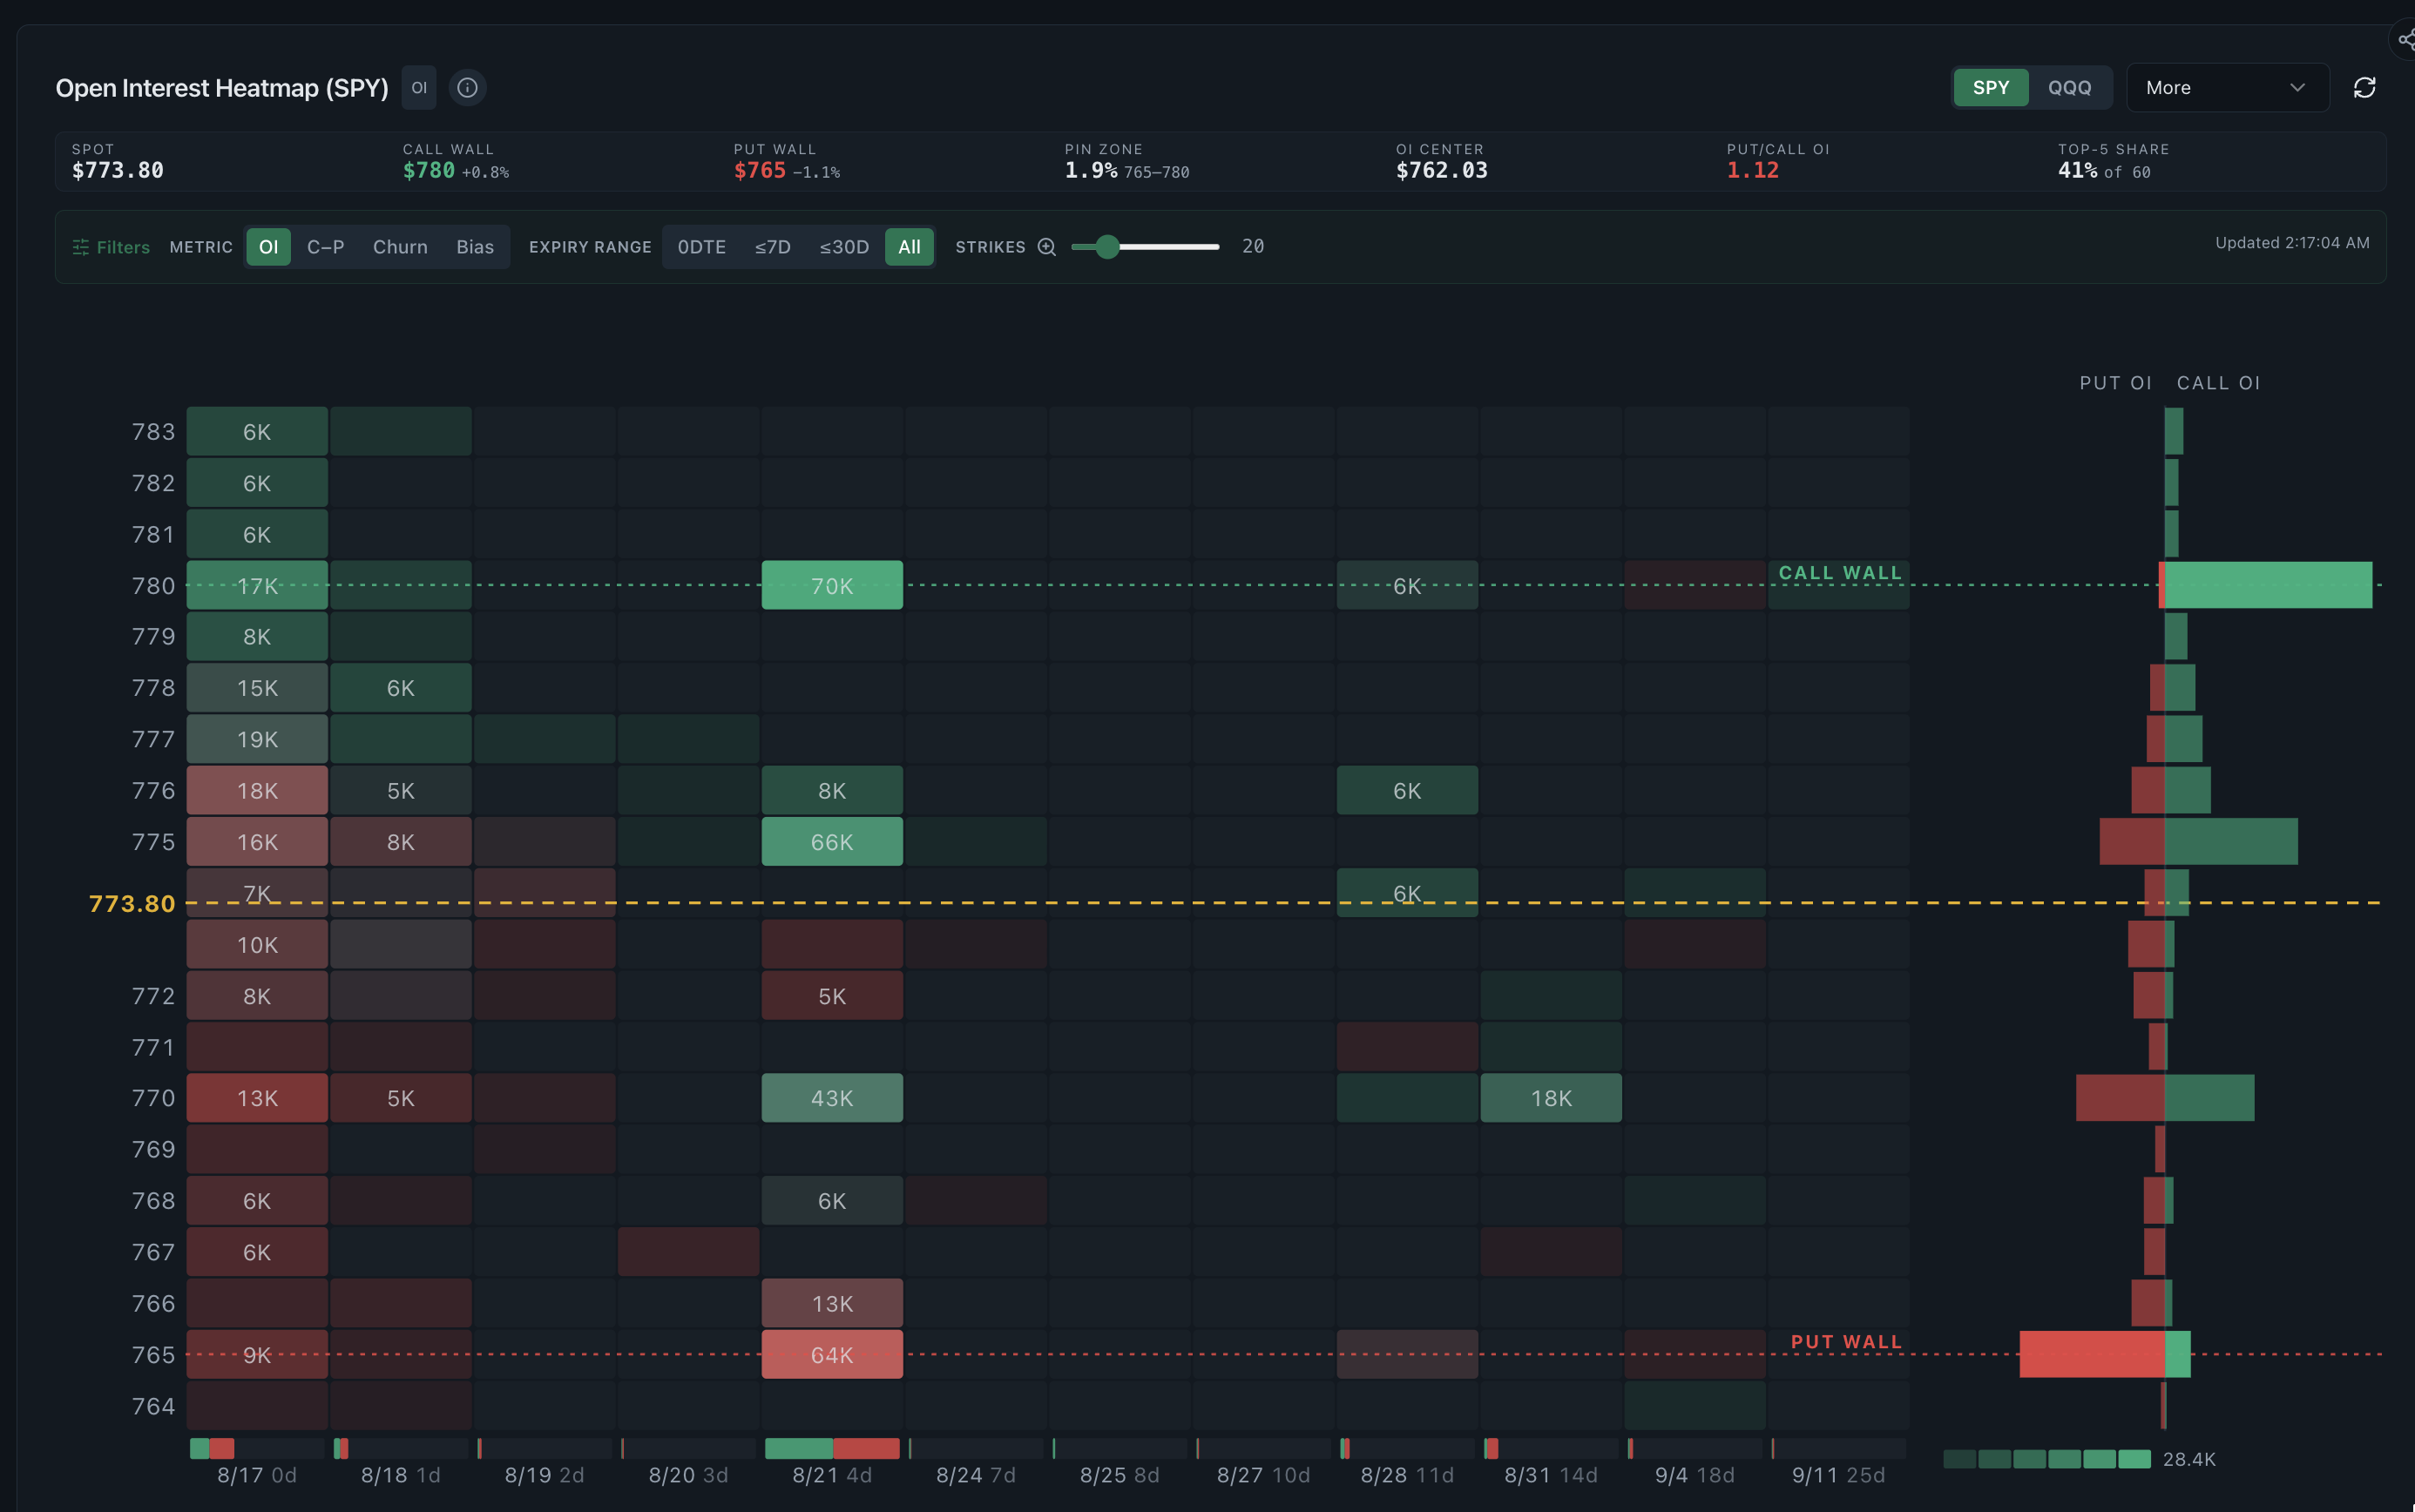
    Premium heatmap by strike with call and put open interest by strike below it

    Premium heatmap and open interest

    Where does new premium meet existing positioning?

    Net premium by strike is stacked above open interest by strike, which shows where fresh activity is landing on top of positions that are already there.

    • Net premium heatmap by strike
    • Call and put open interest
    • Strike-level option chain context

    Also included in every plan

    Weighted net flow

    Is options pressure confirming or fighting price?

    Calls, puts, sentiment and price on one intraday chart.

    Premium heat grid

    Which strike and expiry carries the exposure?

    Premium, GEX and VEX across 0DTE and later expiries.

    Flow map and Greeks by strike

    Where is flow building and where does hedging matter?

    Ticker tiles beside gamma, vanna and charm per strike.

    0DTE and GEX

    Where can same-day positioning create friction?

    Scaled gamma exposure around the current price.

    Whales positioning

    What happened after a large contract hit the tape?

    Ask, mid and bid premium with volume, open interest and price.

    Market news context

    What catalyst could explain the flow?

    Ticker-filtered headlines with timing and source.

    Screenshots of these six are in the dashboard tour above. Every dashboard listed here is part of the single $25 per month plan.

    Options trading data coverage

    One research dashboard for the US options market: options flow, quote context, option chains, open interest and sentiment, updated continuously through the trading day.

    Options flow and market data

    Near real-time options flow with sweep and block detection, unusual options activity, net premium, volume and put/call ratio trends, so you can research how aggressive money is positioning across the market.

    Calls, puts and option chains

    Calls and puts across every strike and expiry: option chain heatmaps, open interest by strike, Greeks including gamma, vanna and charm, plus contract-level bid, mid and ask premium context.

    US stocks, ETFs and 0DTE

    Thousands of US-listed stocks and ETFs including SPY and QQQ options, large caps and active single names, plus 0DTE gamma exposure analytics and futures context for ES and NQ.

    Data is aggregated from licensed third-party sources and processed into analytics. It is not a direct exchange feed, and there is no public options data API. Read how the data is sourced or see the tools it feeds.

    What the options flow dashboard covers

    One subscription, one workflow. Everything listed here is part of the platform rather than a paid add-on.

    Options flow scanner
    Sweeps, blocks and large single prints across US stocks and ETFs, filterable by size, side and sentiment.
    Real time options quotes context
    Contract-level premium at the bid, mid and ask over time, next to price, volume and open interest.
    Option chain data by strike
    Premium and open interest broken out strike by strike and expiry by expiry, with Greeks per strike.
    Put activity and put/call ratio
    Put premium tracked separately from calls, with the ratio charted through the session and over weeks.
    0DTE and gamma exposure
    Same-day positioning and scaled GEX around spot, including the strike carrying the largest exposure.
    Multi-ticker screening
    Rank thousands of tickers by net premium, volume or unusual activity to decide what to look at first.
    Market news and calendar
    Ticker-filtered headlines and scheduled events so a flow spike can be matched to a catalyst.
    Historical flow for research
    Look back at previous sessions to check whether a pattern has shown up before and what followed it.
    Configurable notifications
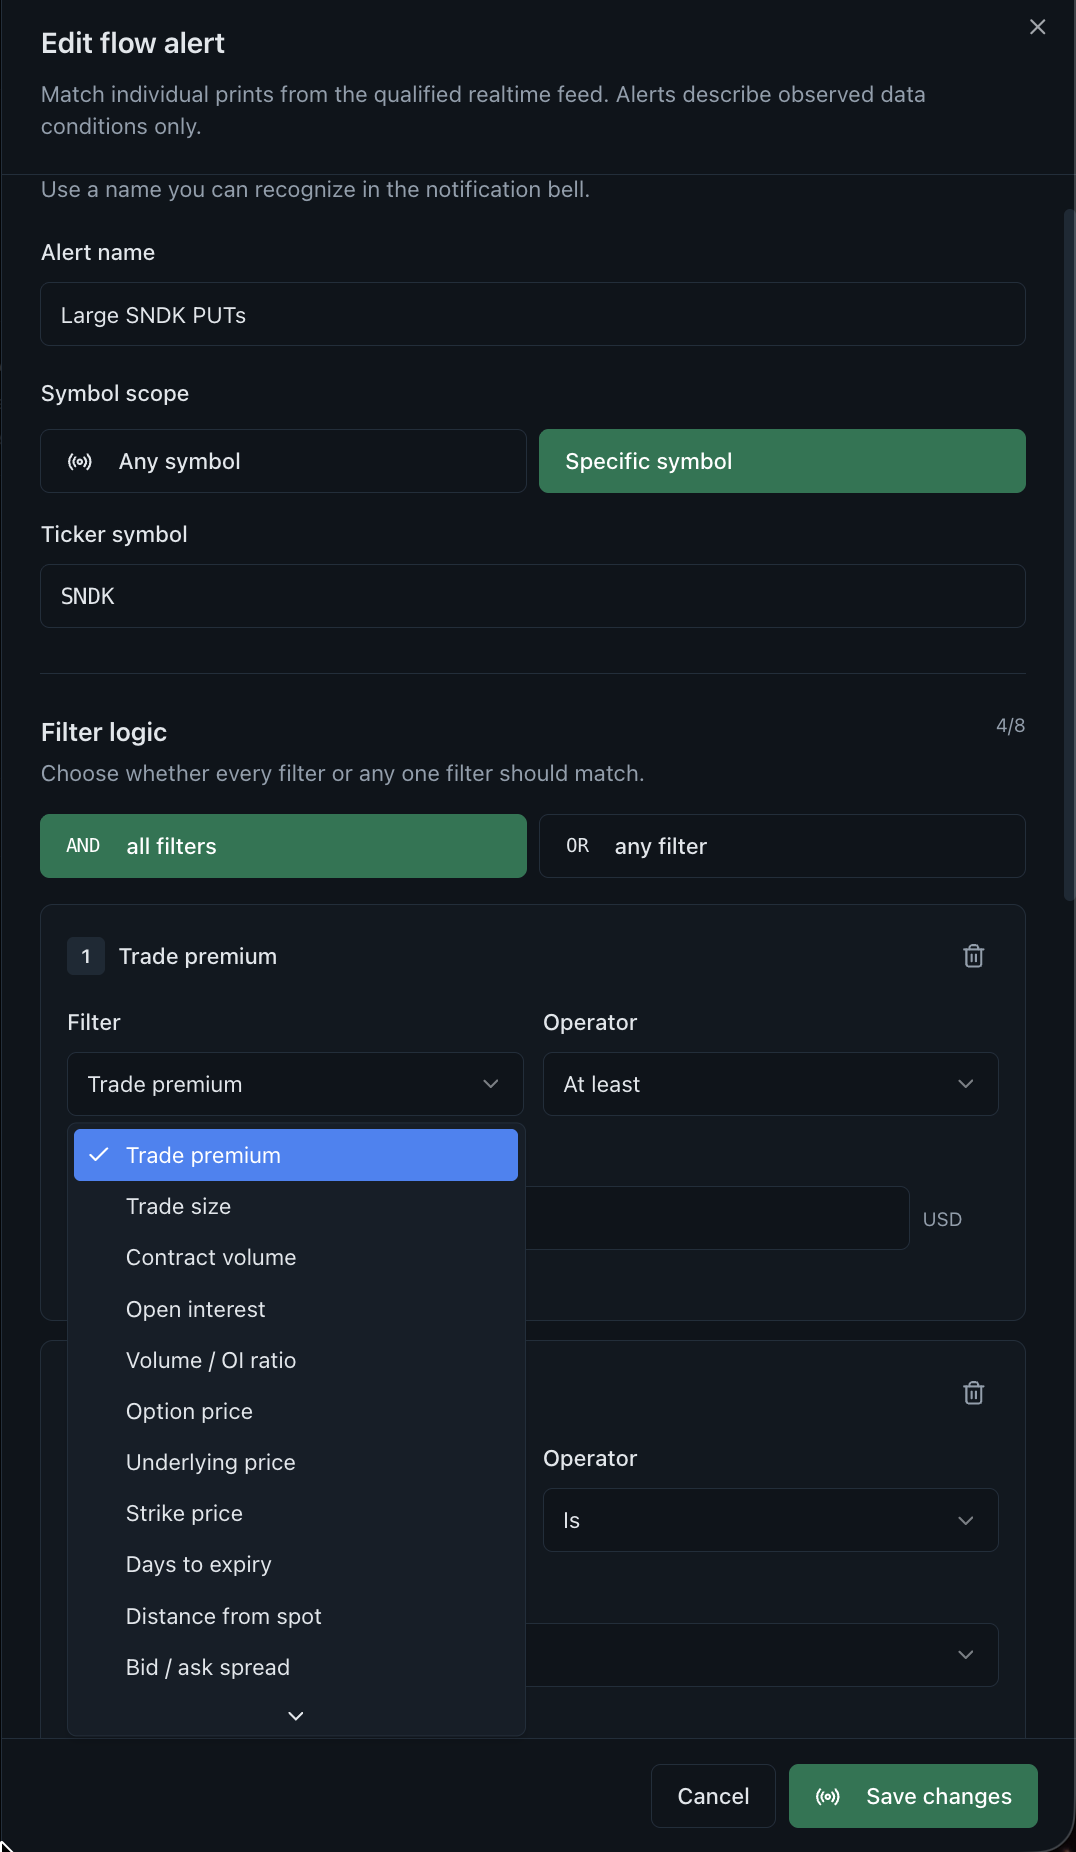
    Get told when the data crosses a threshold you set. The platform reports activity, it never tells you to trade.

    How a session on the platform actually goes

    No setup calls, no integrations, no signals telling you what to buy. You get the data organised and you do the research.

    1. Step 1

      Set up your watchlist

      Pick the tickers you follow and the thresholds worth being told about. It takes a few minutes and there is nothing to install or connect.

    2. Step 2

      Watch the flow during the session

      Weighted net flow, the heat grid and the tape update continuously while US markets are open. Trial accounts see the same screens on a 15-minute delay.

    3. Step 3

      Check a signal against context

      Before acting on anything, cross-check it: strike-level exposure, open interest, the trend over recent weeks, and the news on that ticker. Then make your own call.

    Find the workflow that matches your research

    Start market-wide, drill into the names carrying the flow, then check each idea against strike-level positioning, history and news. The software organises the evidence; it never tells you what to trade.

    An options research workflow before the open

    Check where premium landed yesterday, which strikes hold the open interest, and what news is scheduled. Build a short list rather than reacting to the first alert of the day.

    Useful for: Self-directed traders

    Real time market research during the session

    Watch net premium against price to see whether options flow is backing the move. When the two disagree, that disagreement is the thing worth studying.

    Useful for: Independent analysts

    Real time trade visibility on one name

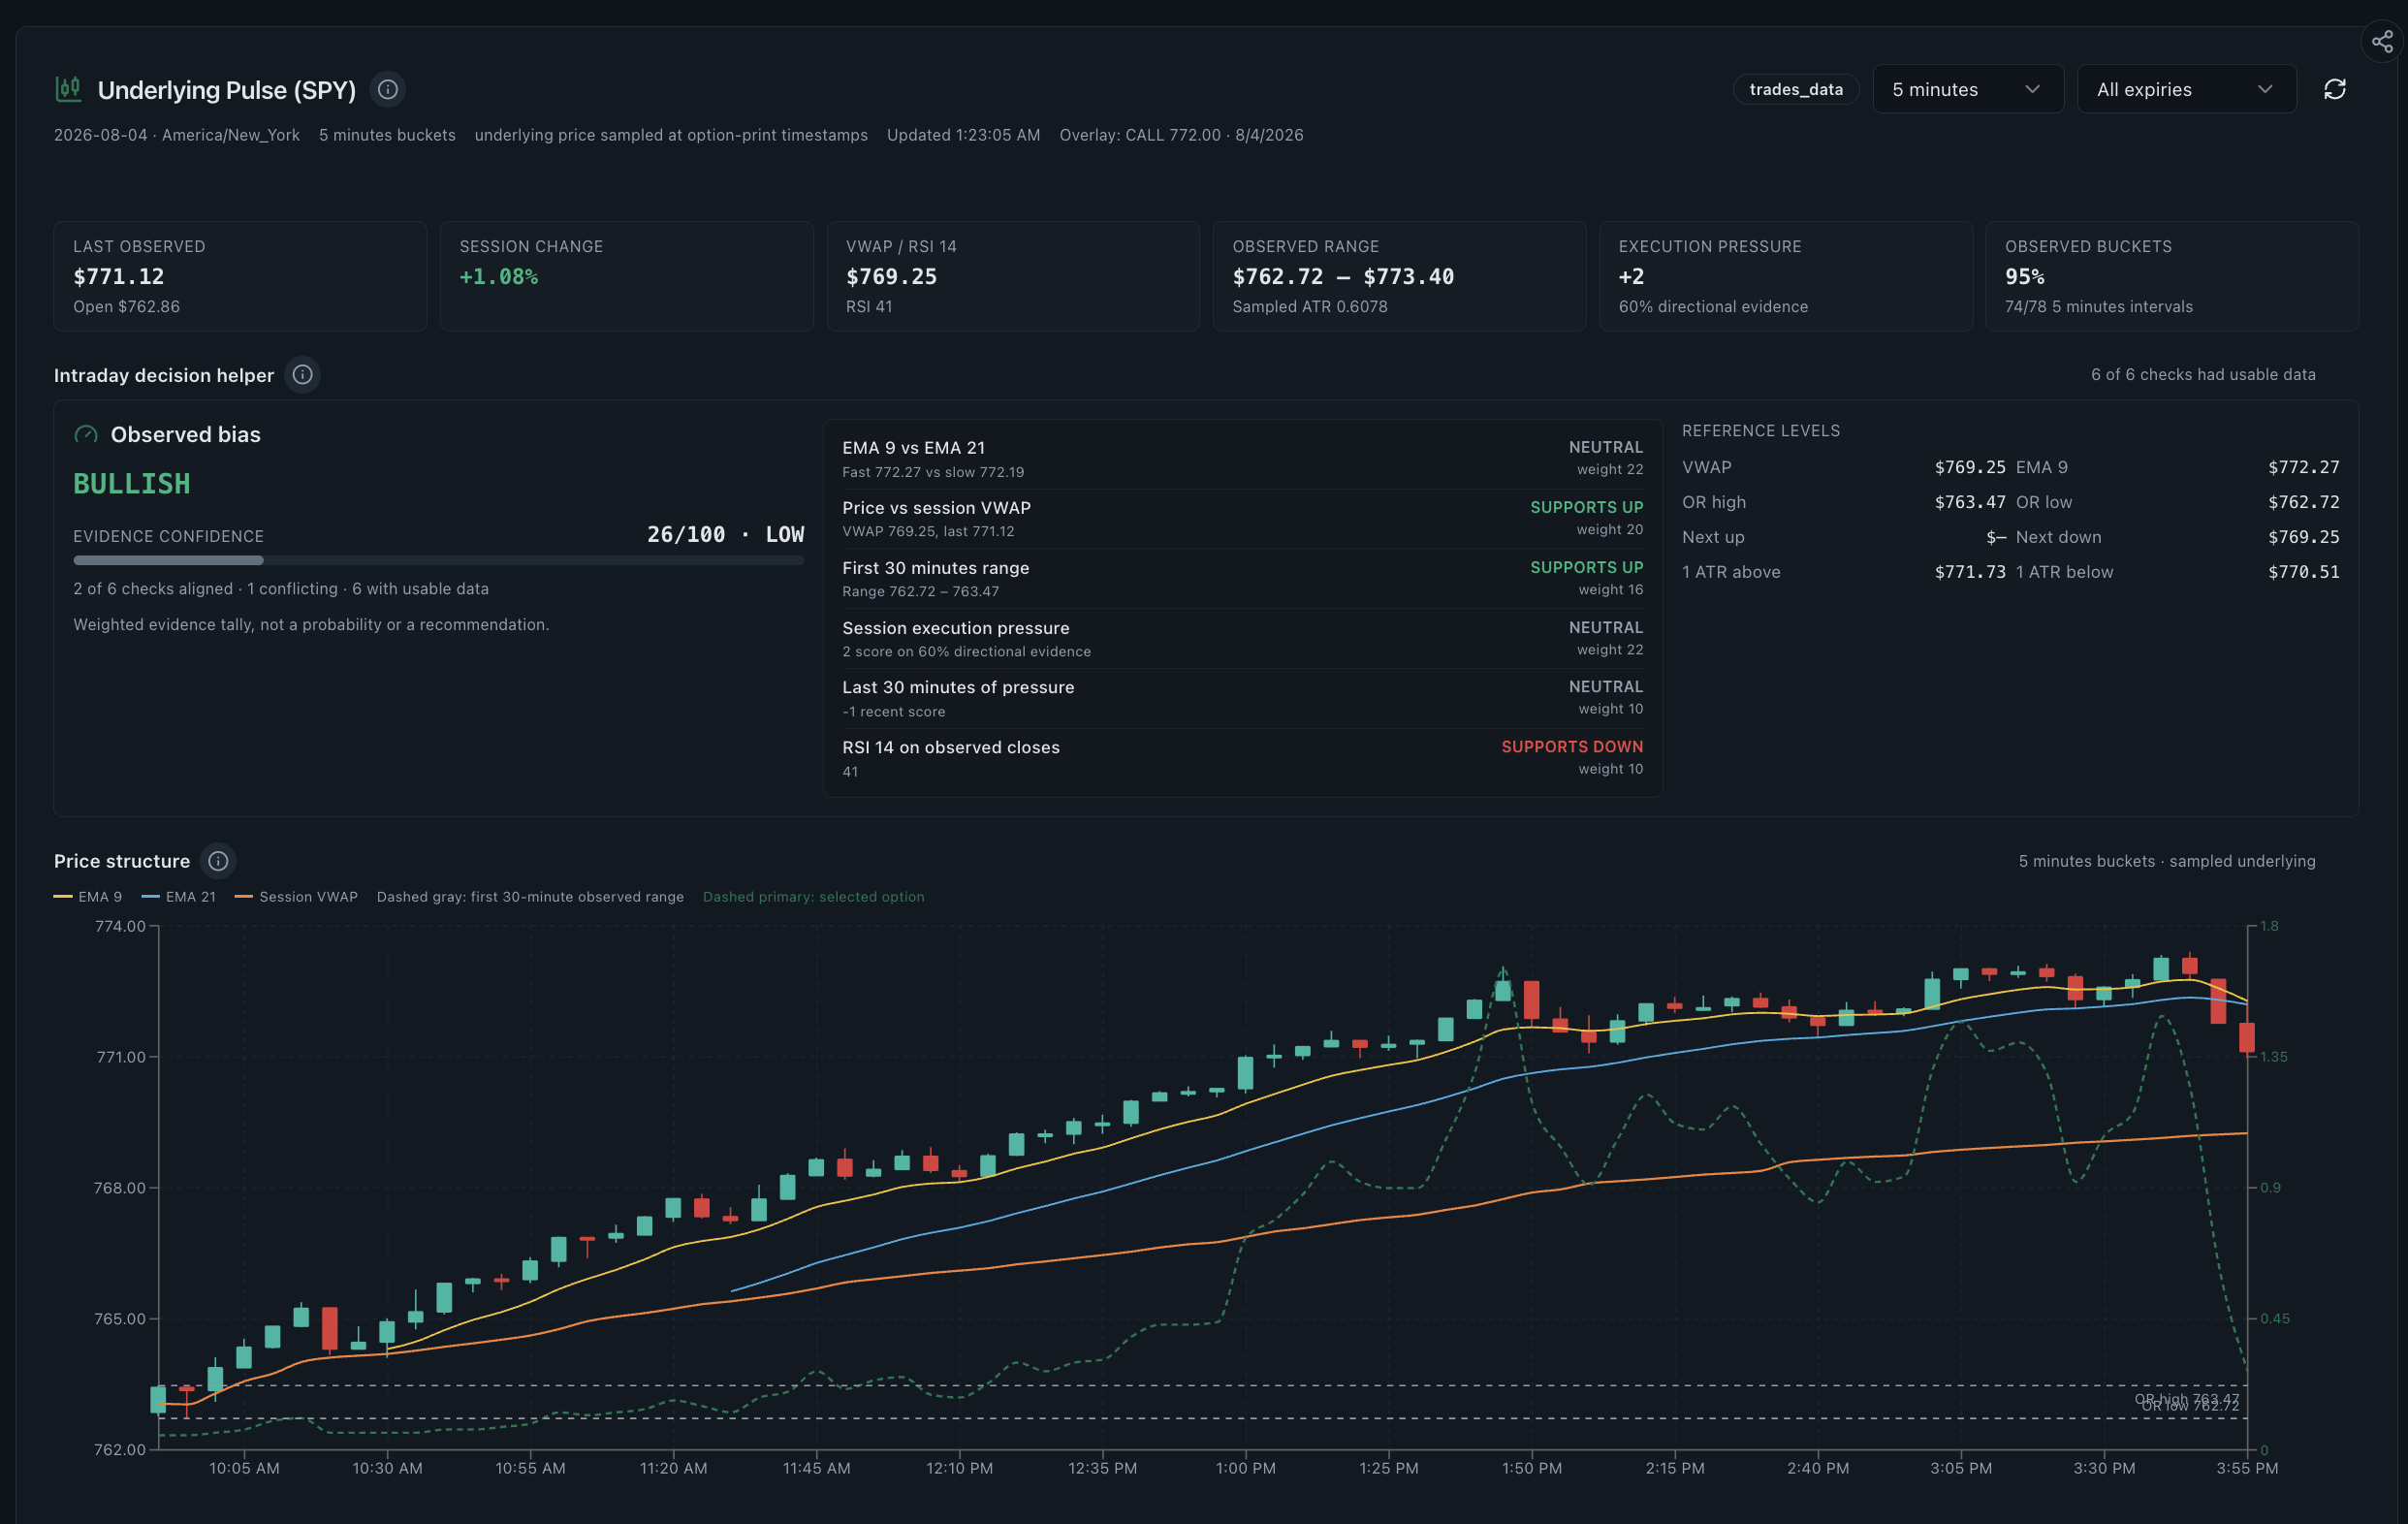
    Follow one ticker end to end: the prints hitting the tape, the strikes they land on, and how bid, mid and ask premium behaved after a large contract traded.

    Useful for: Single-ticker traders

    Options market data visualization for teaching

    Use historical flow and chain structure to explain concepts such as gamma exposure, open interest and the put/call ratio with real market examples instead of textbook diagrams.

    Useful for: Educators and students

    Sentiment monitoring across sectors

    Compare sector flow week over week to see where positioning is rotating, then drill into the two or three names driving the sector reading.

    Useful for: Macro-minded researchers

    Multi-ticker screening

    Rank the whole universe by net premium or unusual activity, then cut the list down with filters until it is short enough to research properly.

    Useful for: Screener-first traders

    These are product workflow examples written by Realtime Options, not customer testimonials or performance claims.

    Pricing: one plan, $25 per month

    A low cost platform for options flow data. There are no tiers to compare, no seat minimums and no add-on data packages. Start on the free trial and upgrade only if the dashboards earn their place in your routine.

    Show prices in

    Start here

    Free trial

    Freefor 7 days

    The whole platform on a 15-minute delay, so you can judge the dashboards on real market data before paying.

    • All 10 research dashboards
    • Real market data with a 15-minute delay
    • Market news, calendar and daily email brief
    • Flow, Greeks, 0DTE, heat grids and contract views
    • No credit card required
    Start the free trial

    7 days · No card · No automatic charge

    Pro access

    $25per month

    Near real-time options flow analytics with no delay applied, historical data and configurable notifications.

    • The same 10 dashboards without the trial delay
    • Unlimited historical data access
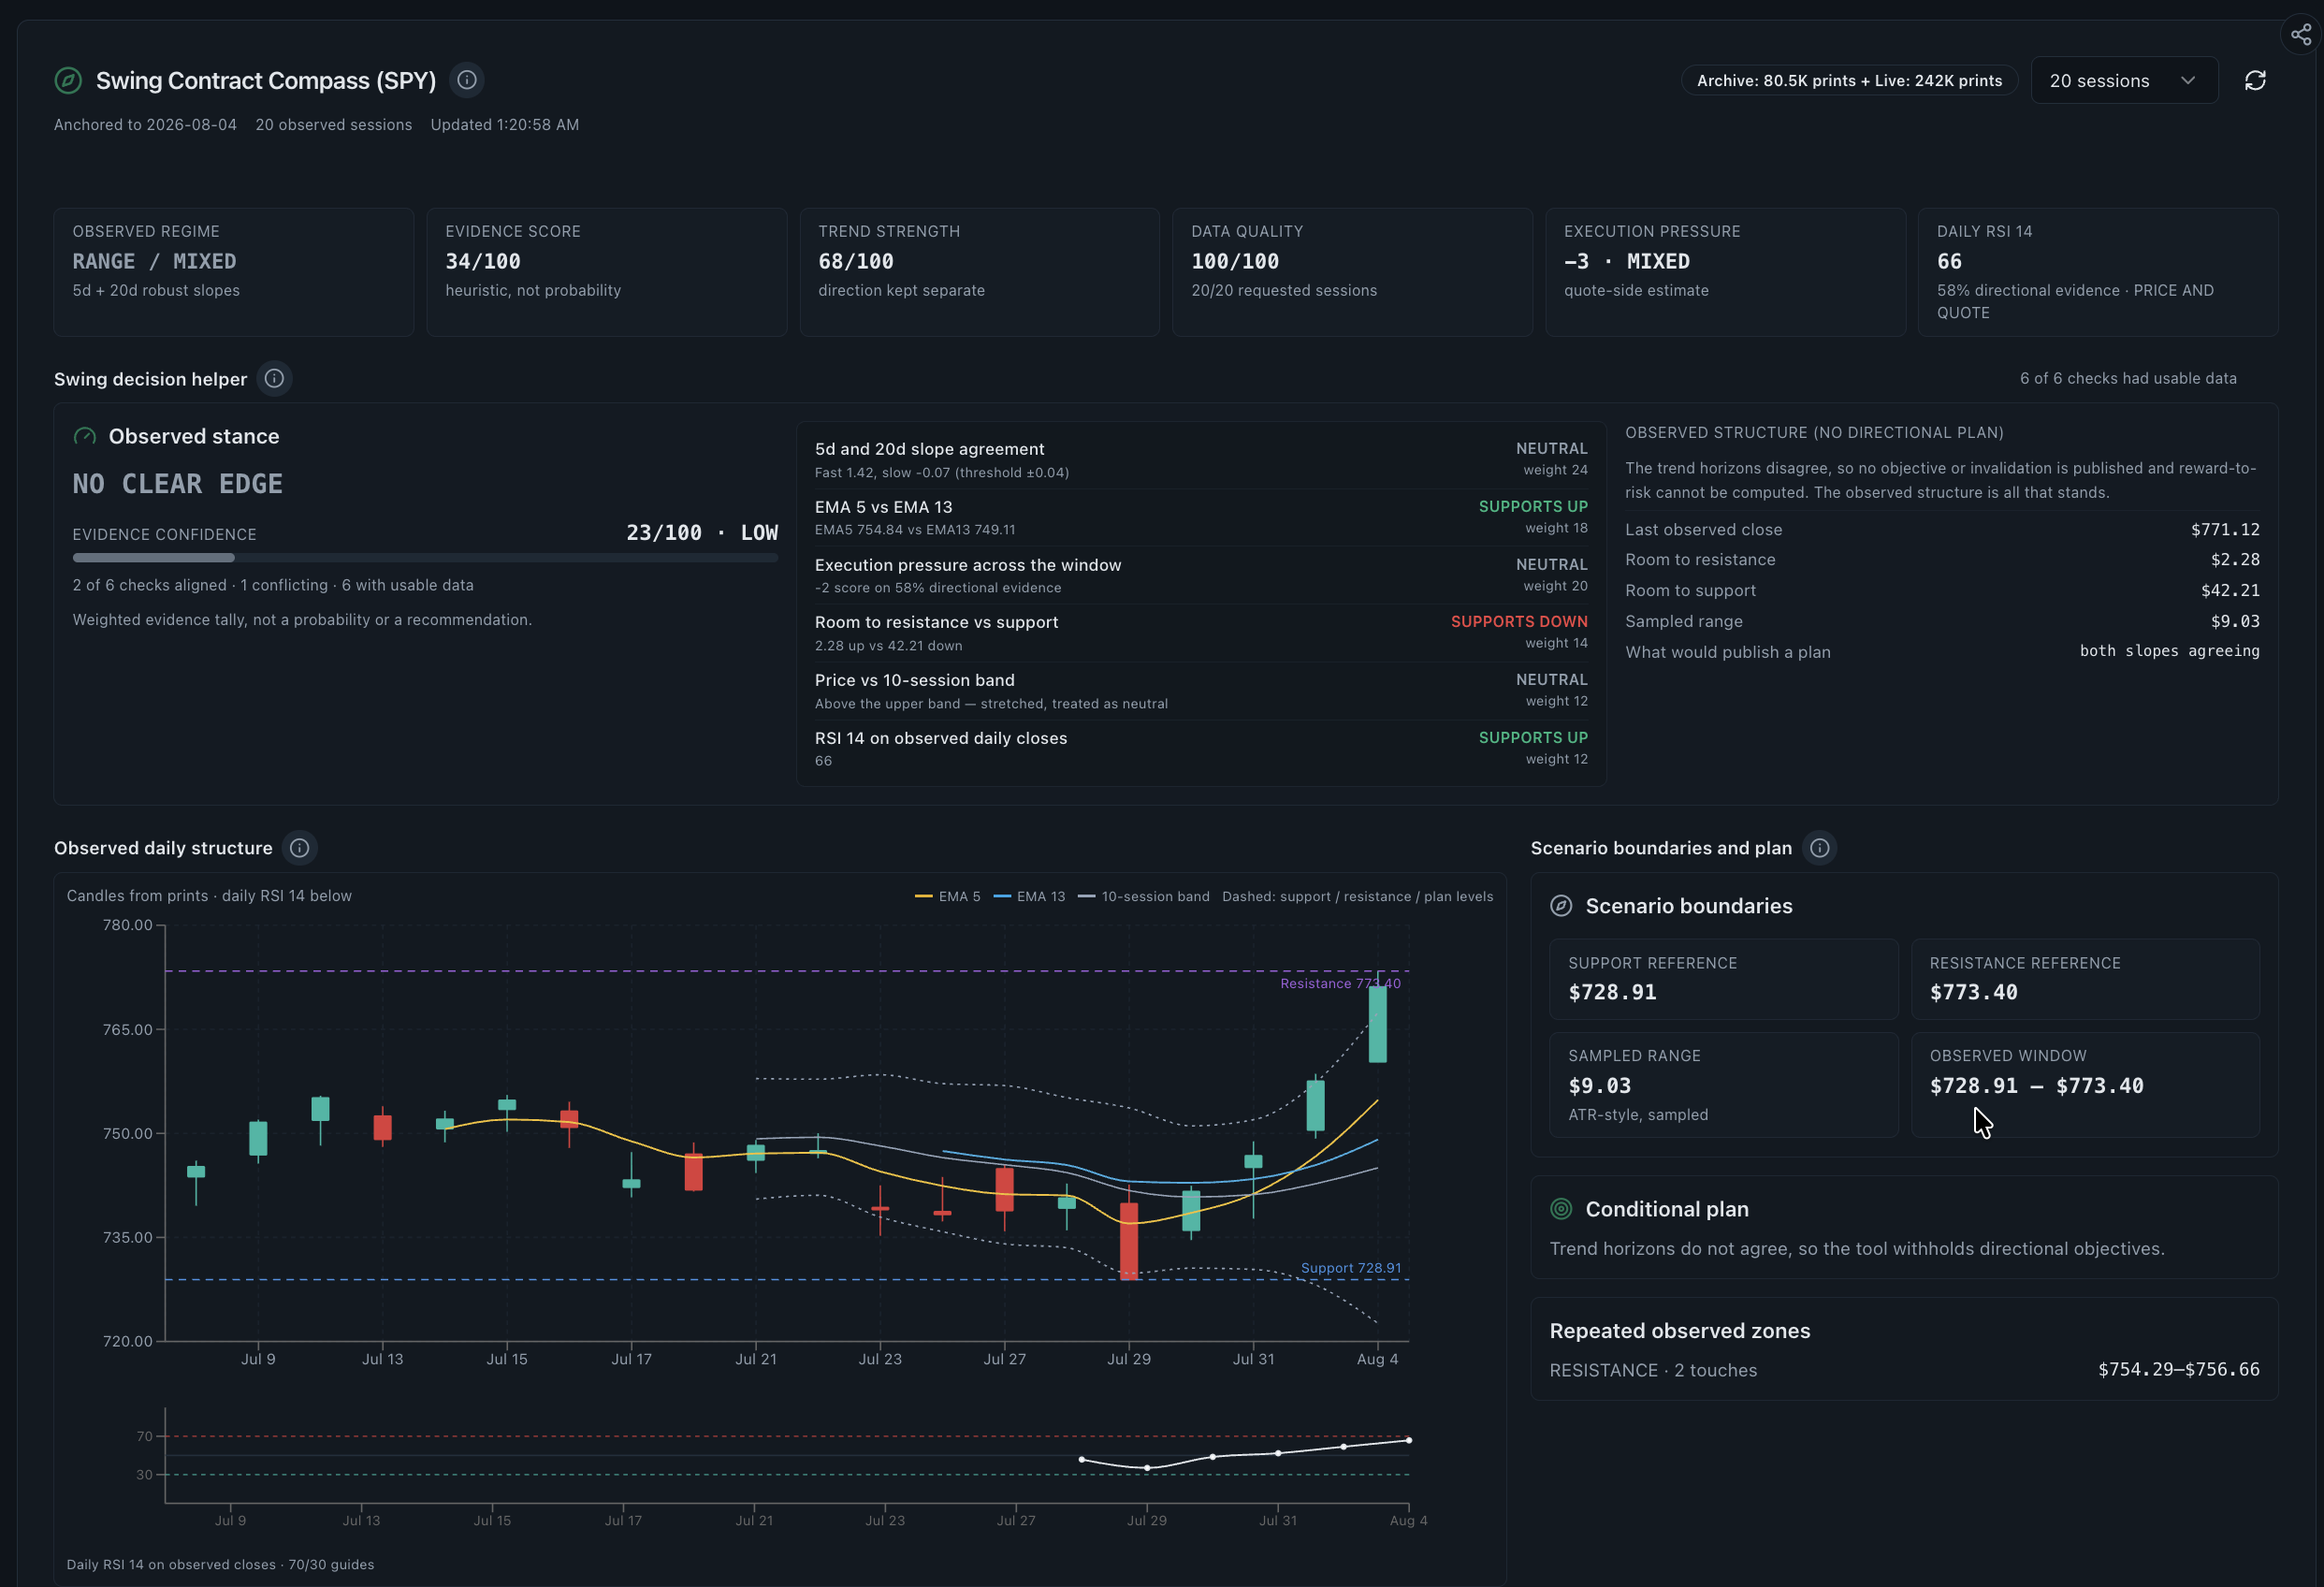
    • Swing trade and 0DTE specialised charts
    • Custom notification configurations
    • Priority support
    • Cancel anytime from the customer portal
    Get Pro access

    Billed in USD via Creem.io · Cancel anytime

    Cancel at any time through the customer portal or your account settings, with access running to the end of the billing period. First-time subscriptions are refundable within 7 days of the charge, and billing errors or extended outages are refunded outside that window too. Read the refund policy for the full terms.

    Frequently asked questions

    Coverage, latency, pricing and the limits of what this platform does. If something is missing, send us the question.

    What is Realtime Options?
    Realtime Options is a market analytics software platform. It organises near real-time options flow, sentiment indicators and historical patterns into dashboards for independent research and education. It does not provide financial advice or trading recommendations.
    What markets do you cover?
    All major US stock options markets, covering thousands of US stocks and ETFs including SPY, QQQ and individual equities with listed options contracts. Futures context for ES, NQ and other major contracts is included as well.
    Do you provide real time options data, or is it delayed?
    Pro accounts see near real-time options data, continuously updated with minimal latency during market hours. Free trial accounts see the same dashboards on a 15-minute delay. The platform is not a direct exchange feed; data is derived from licensed third-party APIs and proprietary processing.
    Do you provide real time options quotes?
    The platform displays near real-time options quote context: contract-level premium at the ask, mid and bid, plus price, volume and open interest inside analytics dashboards. It is not a brokerage quote feed, and it is not intended for order entry.
    Can I see option chain data with strikes and open interest?
    Yes. The premium heatmap and open interest views break call and put activity down strike by strike and expiry by expiry, alongside Greeks by strike including gamma, vanna and charm, so you can research where options contracts are concentrated across the chain.
    How do you track call and put activity?
    Weighted net flow compares call pressure against put pressure in near real time, the flow map splits bullish and bearish premium by ticker, and the flow trend dashboard tracks put/call ratio, net premium, volume and trade count over time across US stock, ETF and index options.
    Do you offer an options data API?
    No. Realtime Options is dashboard software; analytics are for viewing inside the platform and there is no public options data API. If you need programmatic access to raw options data, an exchange-licensed market data vendor is the right fit.
    Can I use this for 0DTE trading?
    The platform includes dedicated 0DTE views: same-day gamma exposure around spot, a heat grid that starts at 0DTE, and continuously updated flow during the session. What you do with that information is your decision; the platform does not issue trade instructions.
    What trading analytics should I monitor in real time?
    Monitor call versus put pressure, net premium, volume, open interest, gamma exposure, 0DTE positioning, price confirmation, sector and ticker flow, and relevant market news. Realtime Options combines these views so each signal can be checked in context instead of being read alone.
    Is Realtime Options a free real-time options flow service?
    No. Realtime Options offers a 7-day free trial with full platform access and 15-minute delayed analytics during the trial. The $25 per month Pro plan provides near real-time options flow analytics. It is not a free exchange quote feed or a public options data API.
    Do you offer a free trial?
    Yes. The trial runs 7 days with full software access and no credit card required. Data feeds are delayed by 15 minutes during the trial so you can evaluate every dashboard on real market data before subscribing.
    How does the pattern detection system work?
    The software analyses historical market data including options flow, sentiment indicators and market conditions, then highlights patterns that resemble past activity and displays them with historical context. It is a research aid, not a recommendation engine, and past patterns do not predict future results.
    What is the difference between near-real-time and real-time data?
    Near real-time analytics are continuously updated with minimal latency, but Realtime Options is not a direct exchange feed. Data is derived through third-party APIs and proprietary analytic processes, which keeps the platform affordable while still being timely enough for research.
    Where does the data come from?
    Market data is licensed from third-party providers and processed through proprietary analytics before it reaches the dashboards. Raw exchange feed data is not republished. Everything shown is aggregated output intended for independent research.
    How do I cancel my subscription?
    Cancel anytime through the Creem customer portal, from your account settings, or by emailing [email protected]. There are no cancellation fees and access continues to the end of the billing period.
    What is your refund policy?
    Refunds are available for first-time subscriptions within 7 days of the charge, and for billing errors, unresolved technical issues or extended service outages. Email [email protected] and we respond within 3 business days. Full terms are on the refund policy page.
    Do you provide financial advice?
    No. Realtime Options is a data analytics and visualisation platform. It is not a registered investment advisor or broker-dealer, it does not execute trades, and it does not offer personalised investment advice. Consult a qualified financial advisor before making investment decisions.
    How do you protect my personal data?
    Account data is transmitted over TLS, stored on secure servers with restricted access, and never sold. Handling follows applicable data protection regulations, and the privacy policy sets out what is collected and why.
    What type of service is Realtime Options?
    It is a digital software subscription, classified under MCC 5734 for computer software. The product delivers market analytics through proprietary data processing. It does not execute trades, provide financial advice or recommend trading actions.
    What payment methods do you accept?
    Major credit cards and digital payment methods are accepted through the payment processor. Prices are displayed in USD, PKR, EUR and GBP for convenience, and billing is processed in USD.

    The daily options flow brief

    Every account gets a morning email covering the previous session: where net premium landed, the tickers that carried it, notable 0DTE positioning and the events on the calendar ahead. It is a summary of what the dashboards showed, not a list of trade ideas.

    The brief is included with the free trial, so you can read a few before deciding whether the platform is for you. Turn it off in account settings whenever you like.