Options flow tools and real time options data features

Ten dashboards covering call and put flow, gamma exposure, premium heatmaps, open interest by strike, 0DTE positioning, sector and ticker rotation, and the market news behind a move. Screenshots below are from the platform itself.

See pricing and the 7-day free trial or read the options data FAQ.

See the options trading dashboard before you sign up

Every image below is a screenshot of the actual platform, not a mockup. Switch between the views to see how real time options data is presented, from market-wide flow down to a single contract.

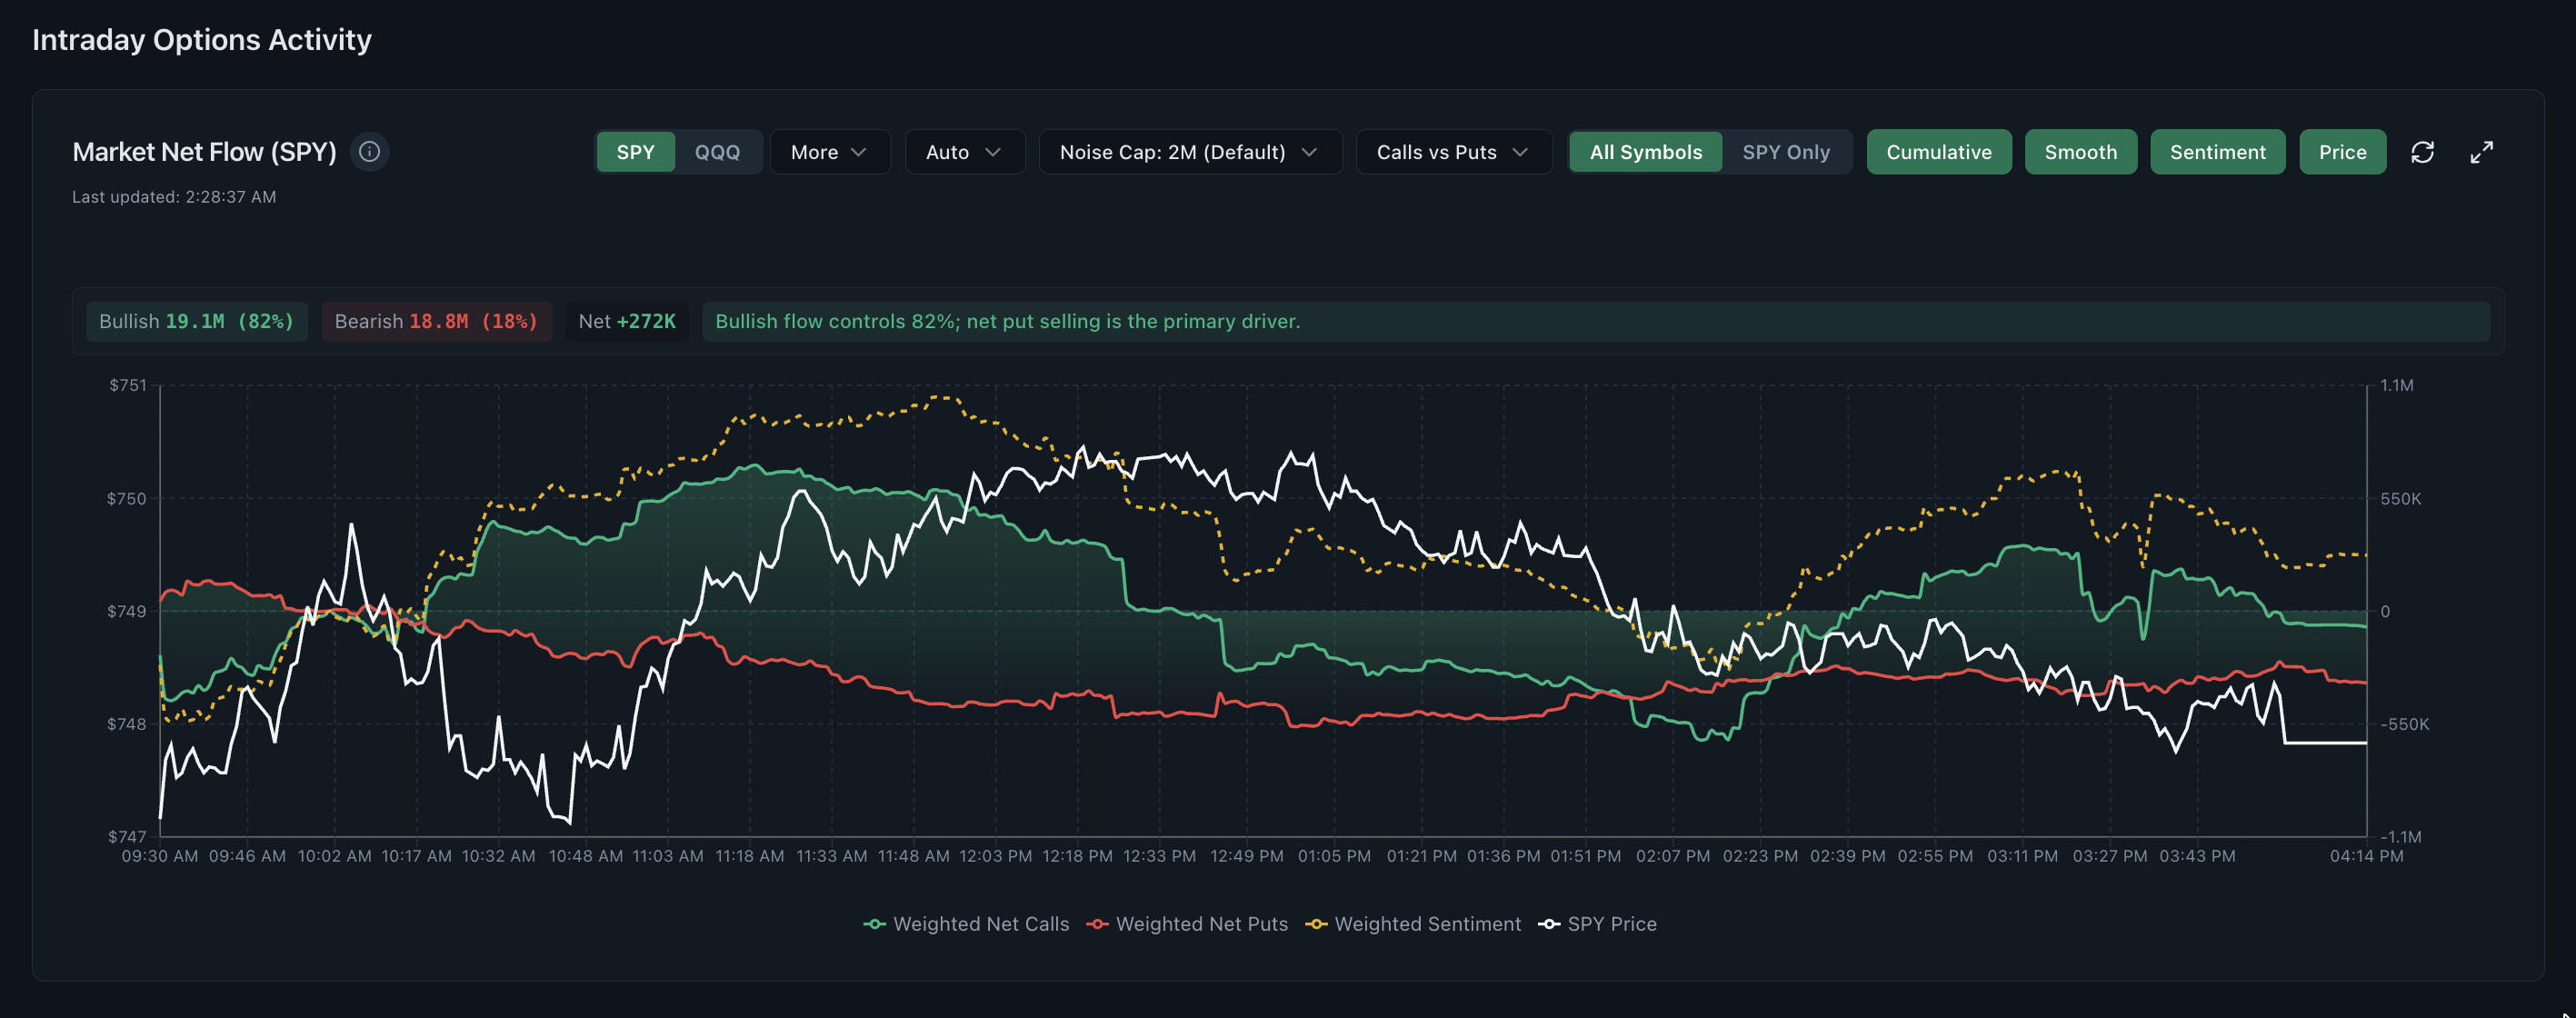
Weighted net flow chart showing real time options flow for calls and puts against SPY price

Real time options flow next to price

The weighted net flow chart puts call pressure, put pressure, sentiment and the underlying price on one intraday view, so you can tell whether options flow is confirming the move or fading it.

  • Call and put premium weighted by aggressiveness
  • Sentiment line and price on the same time axis
  • Session view rebuilt continuously through the day
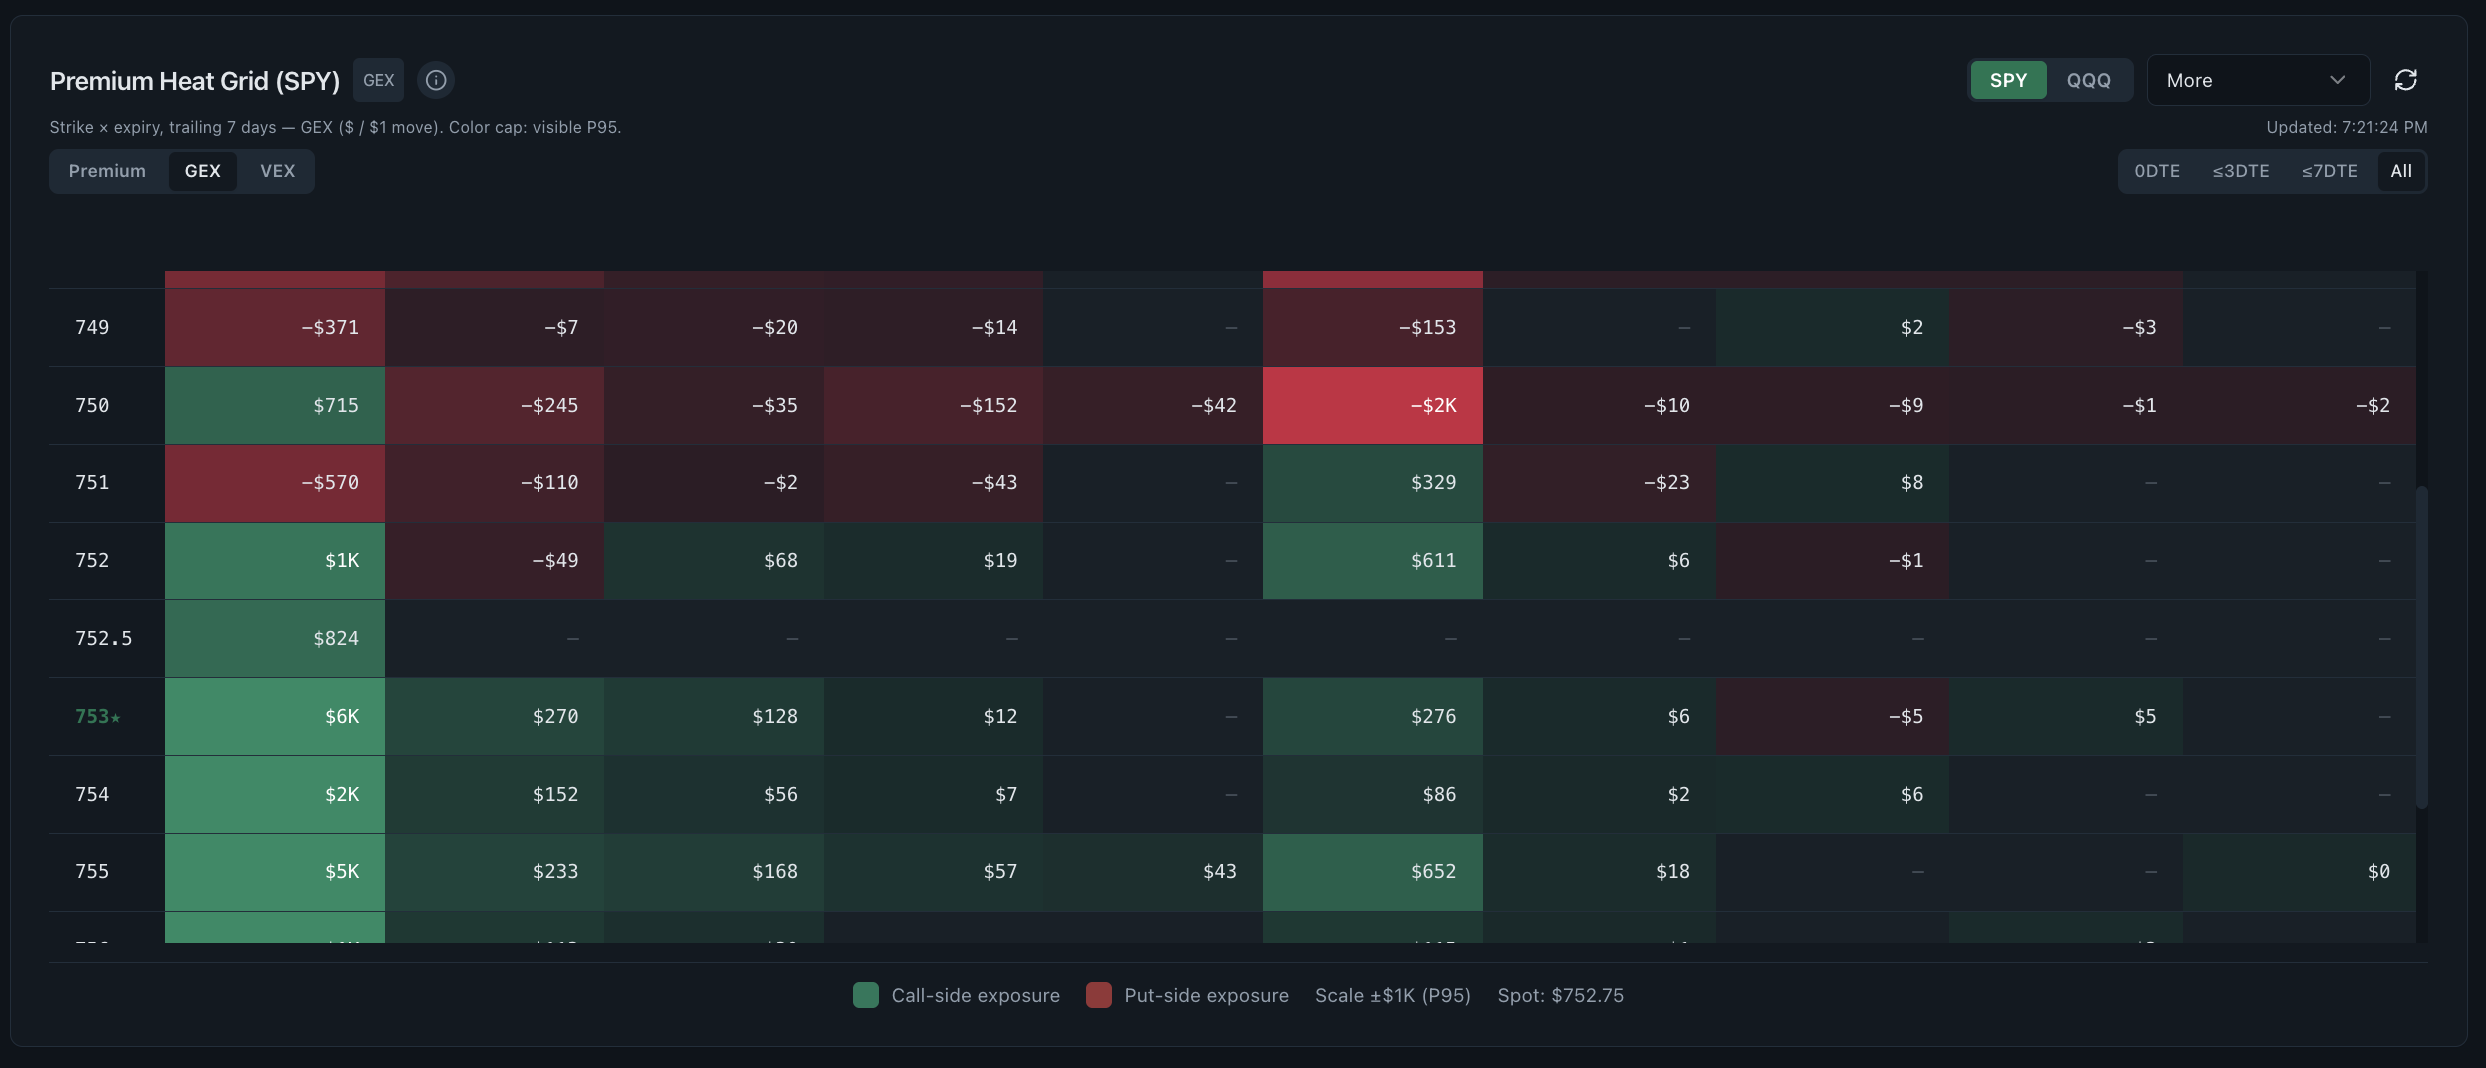
Premium heat grid showing option chain data by strike and expiry with call and put exposure

Option chain data by strike and expiry

The premium heat grid reads like an option chain you can scan at a glance. Switch between premium, gamma exposure and vanna exposure to see which strike and expiry is carrying the position risk.

  • Strike by expiry grid from 0DTE out to later cycles
  • Premium, GEX and VEX modes on the same layout
  • Call side and put side split for real time put activity
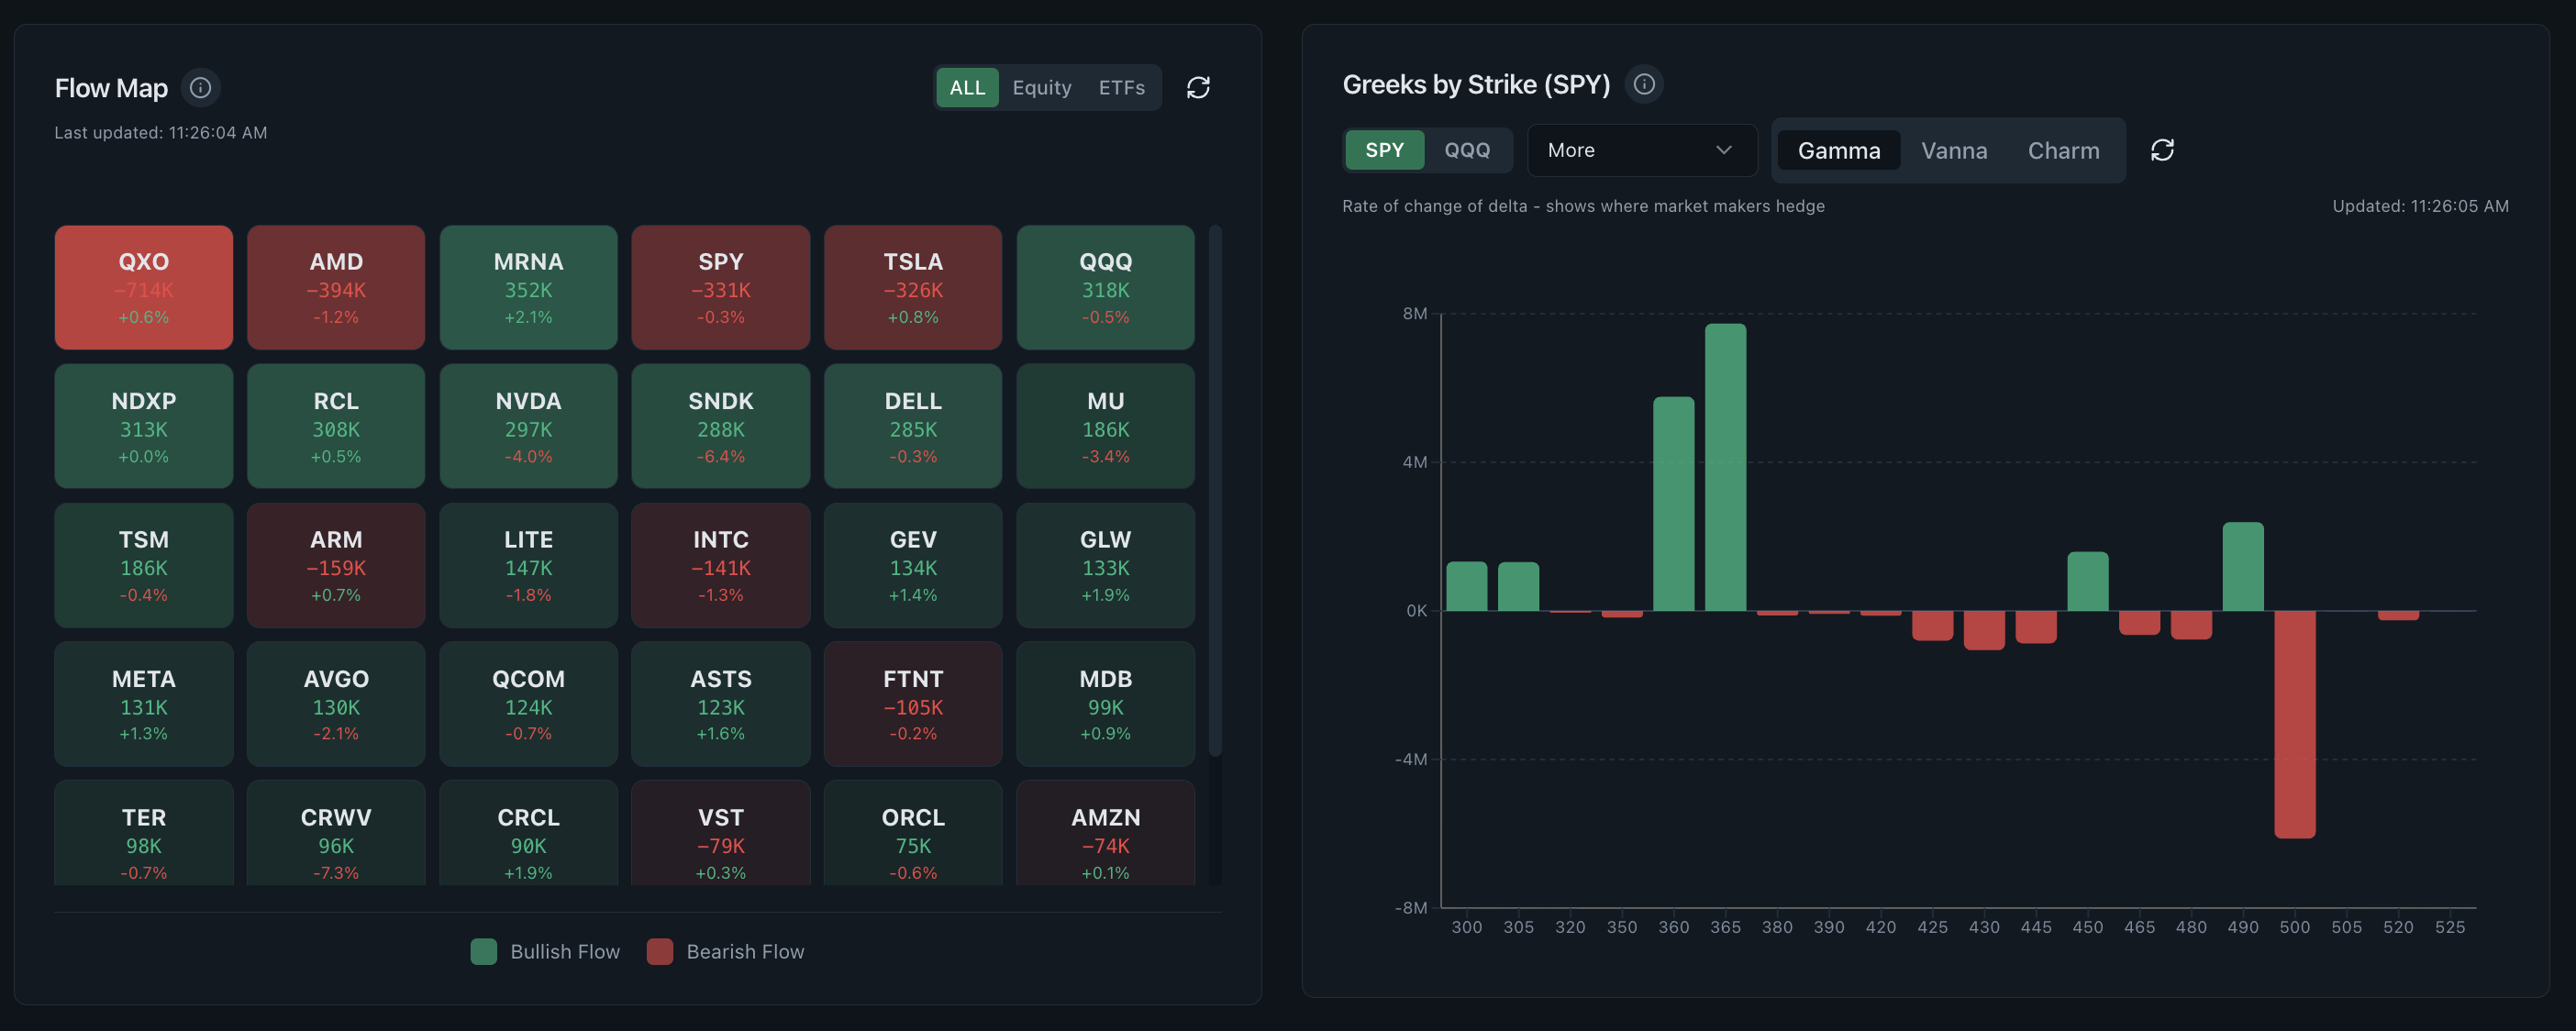
Flow map beside Greeks by strike for SPY showing gamma, vanna and charm controls

Where flow is building, strike by strike

The flow map ranks bullish and bearish tickers side by side with gamma, vanna and charm by strike, which is how you move from a market-wide read to the two or three names worth a closer look.

  • Bullish and bearish ticker tiles ranked by net premium
  • Gamma, vanna and charm plotted per strike
  • Filters for ETFs, single names and index products
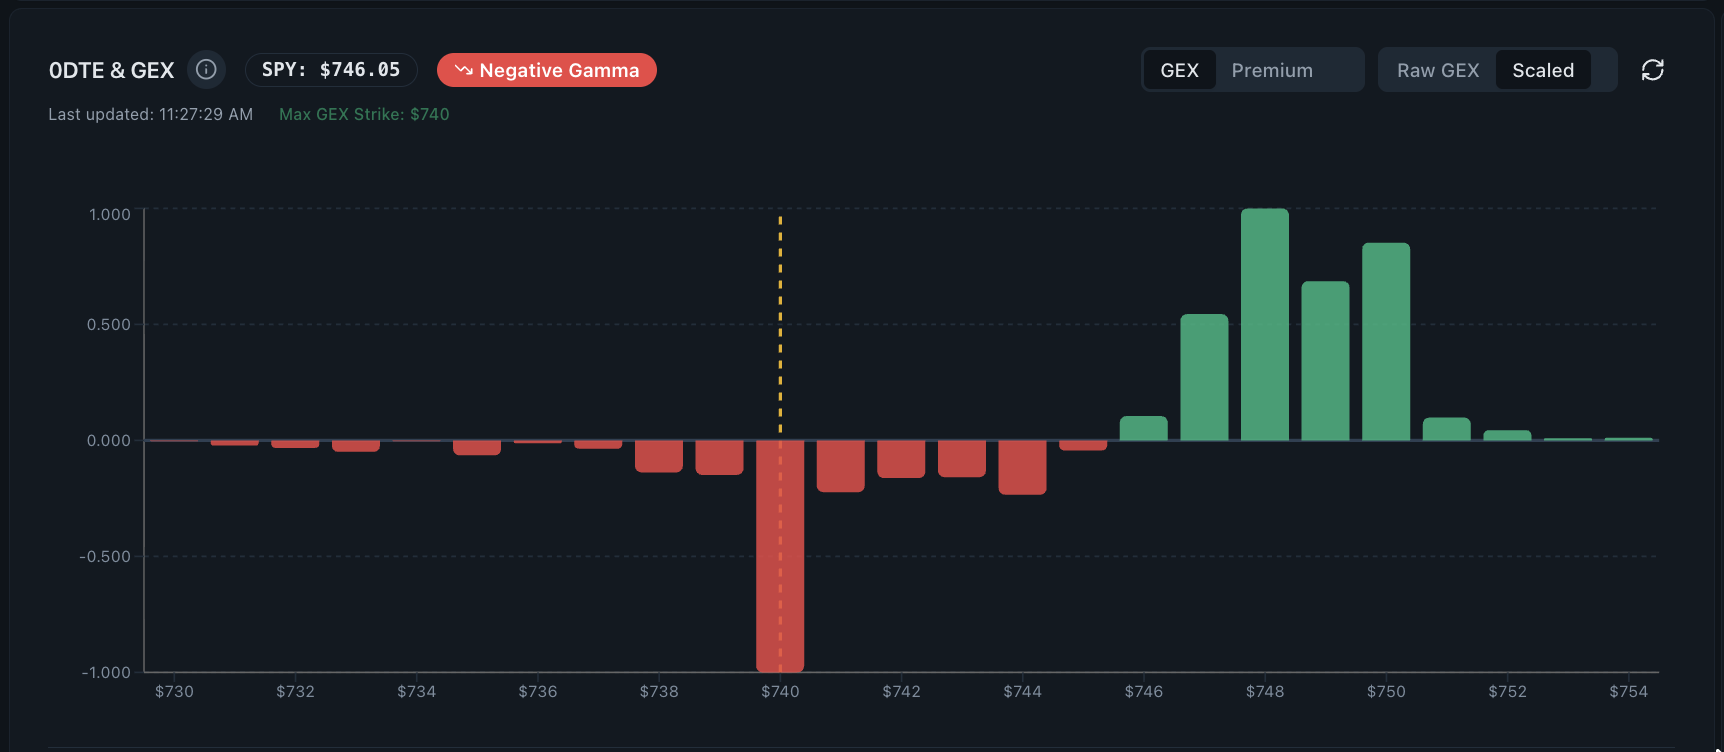
0DTE and GEX chart showing scaled gamma exposure around SPY strike levels

0DTE gamma exposure around current price

Same-day contracts move fast and hedging flows move with them. The 0DTE view plots scaled gamma exposure around spot so you can mark the strikes that tend to act as magnets or pivots.

  • Max GEX strike called out directly on the chart
  • Scaled and raw exposure views
  • Focused on same-day expiries during the session
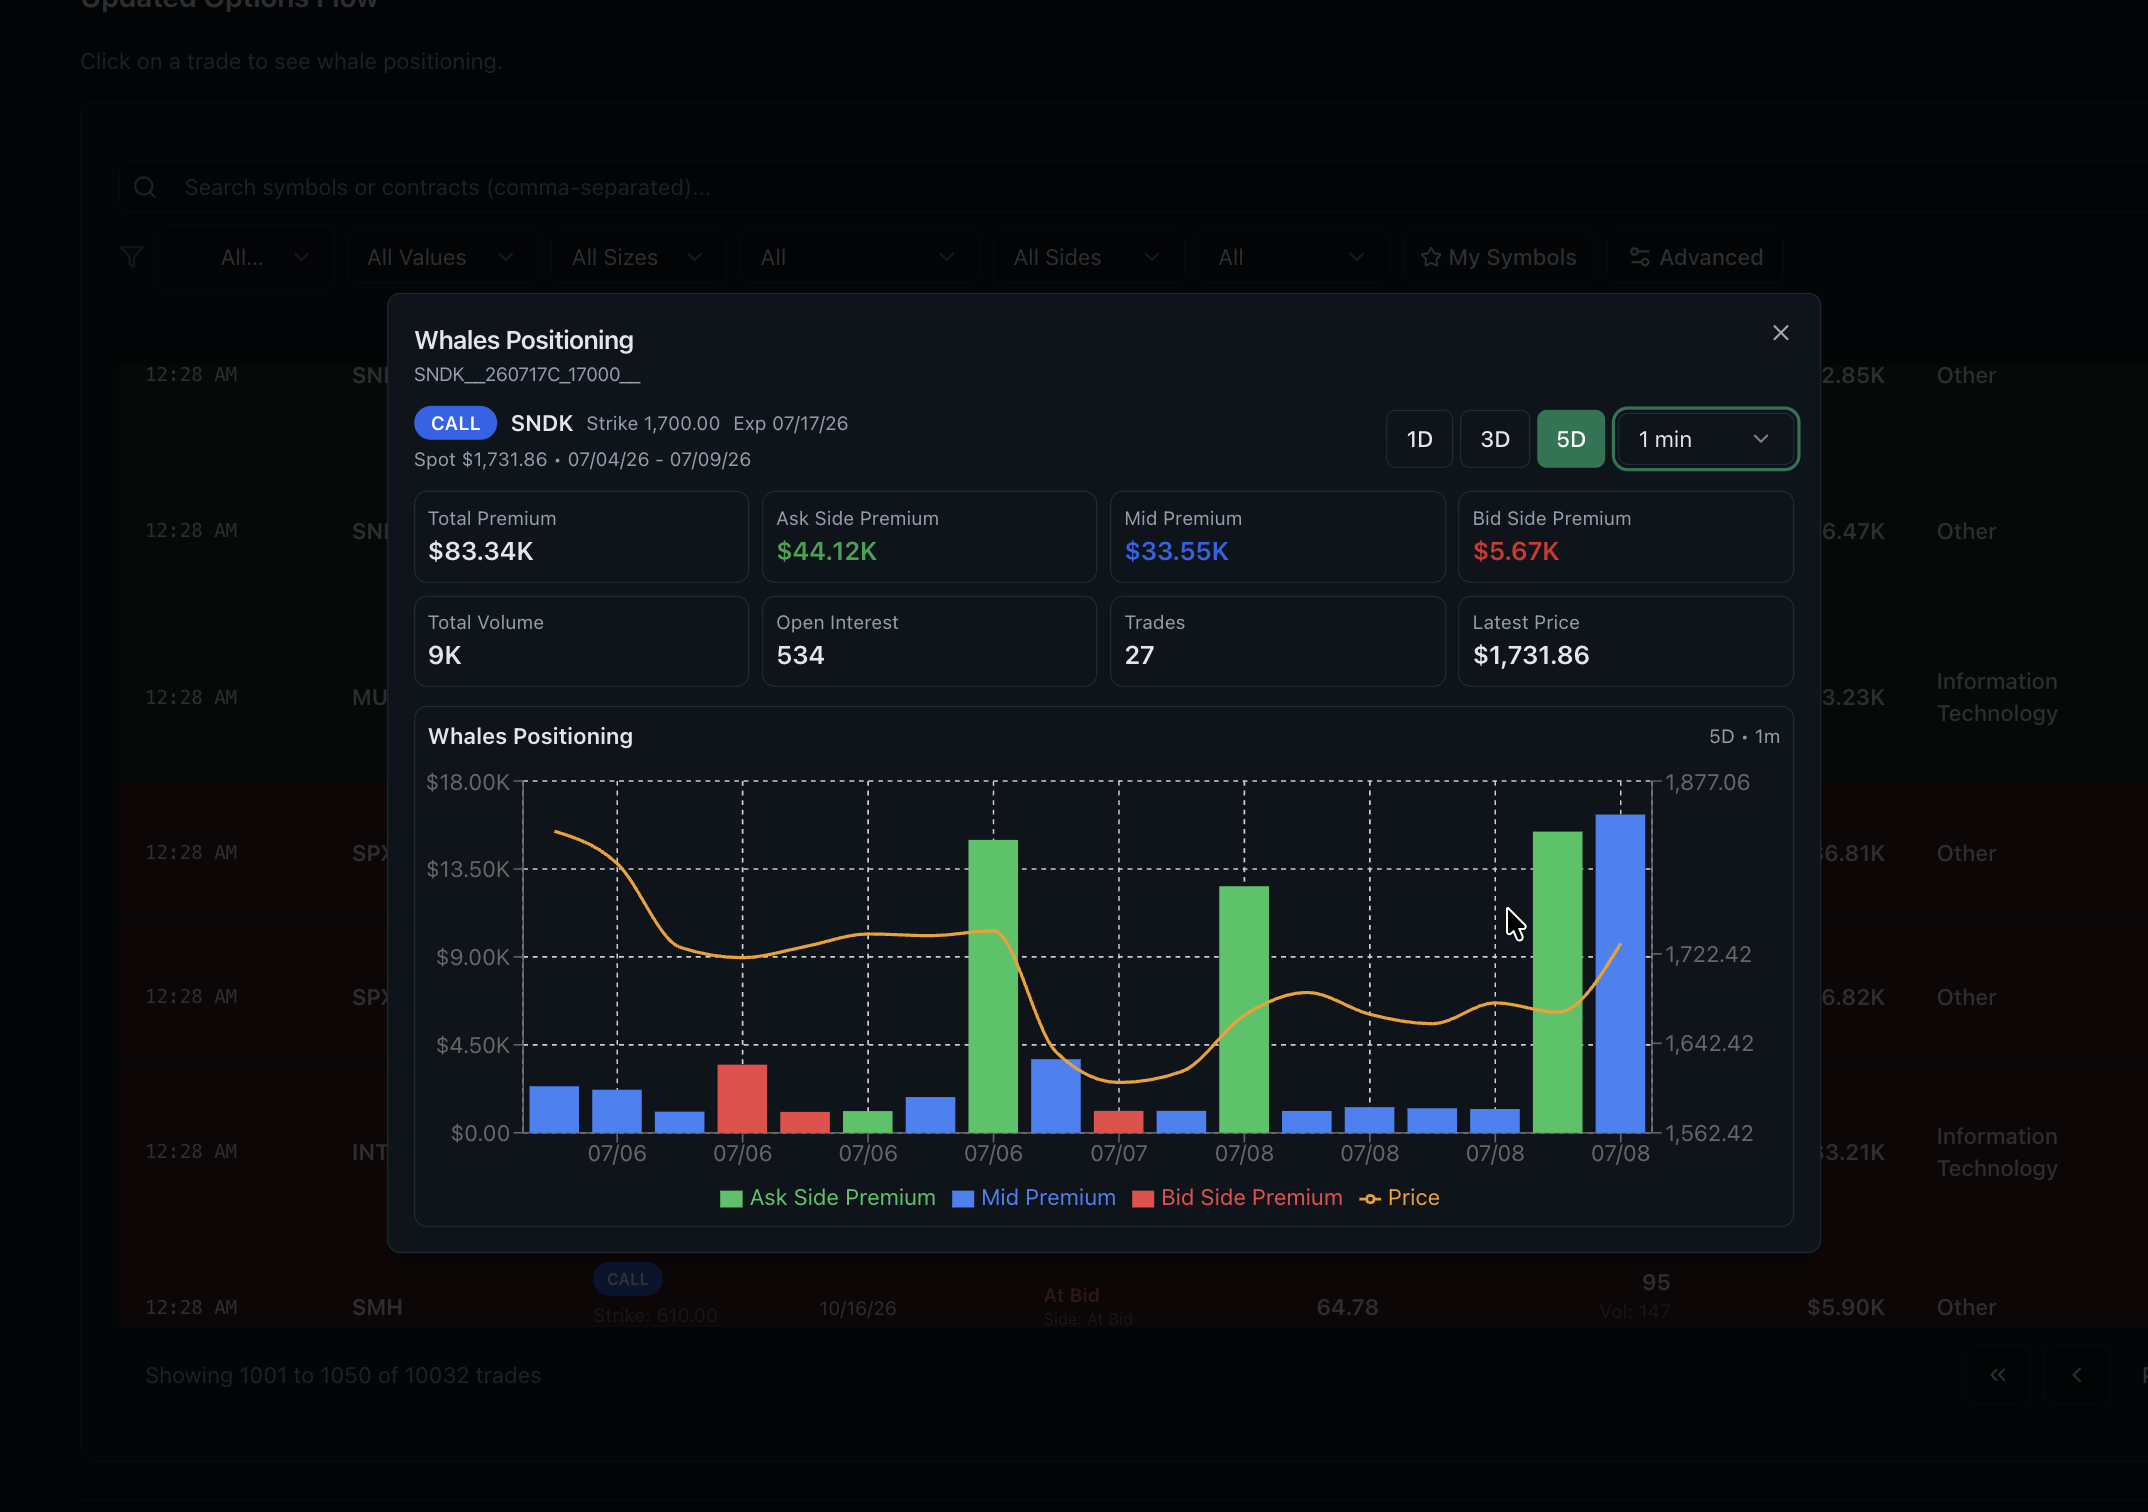
Whales positioning view with ask, mid and bid premium plus volume, open interest and price

Options quotes context on a single contract

Open any large print to see ask-side, mid and bid-side premium over time next to price, volume, open interest and trade count. This is the closest the platform gets to a quote view, and it is contract level rather than a raw exchange feed.

  • Ask, mid and bid premium plotted through the session
  • Volume, open interest and trade count on the same panel
  • 1-day, 3-day and 5-day windows
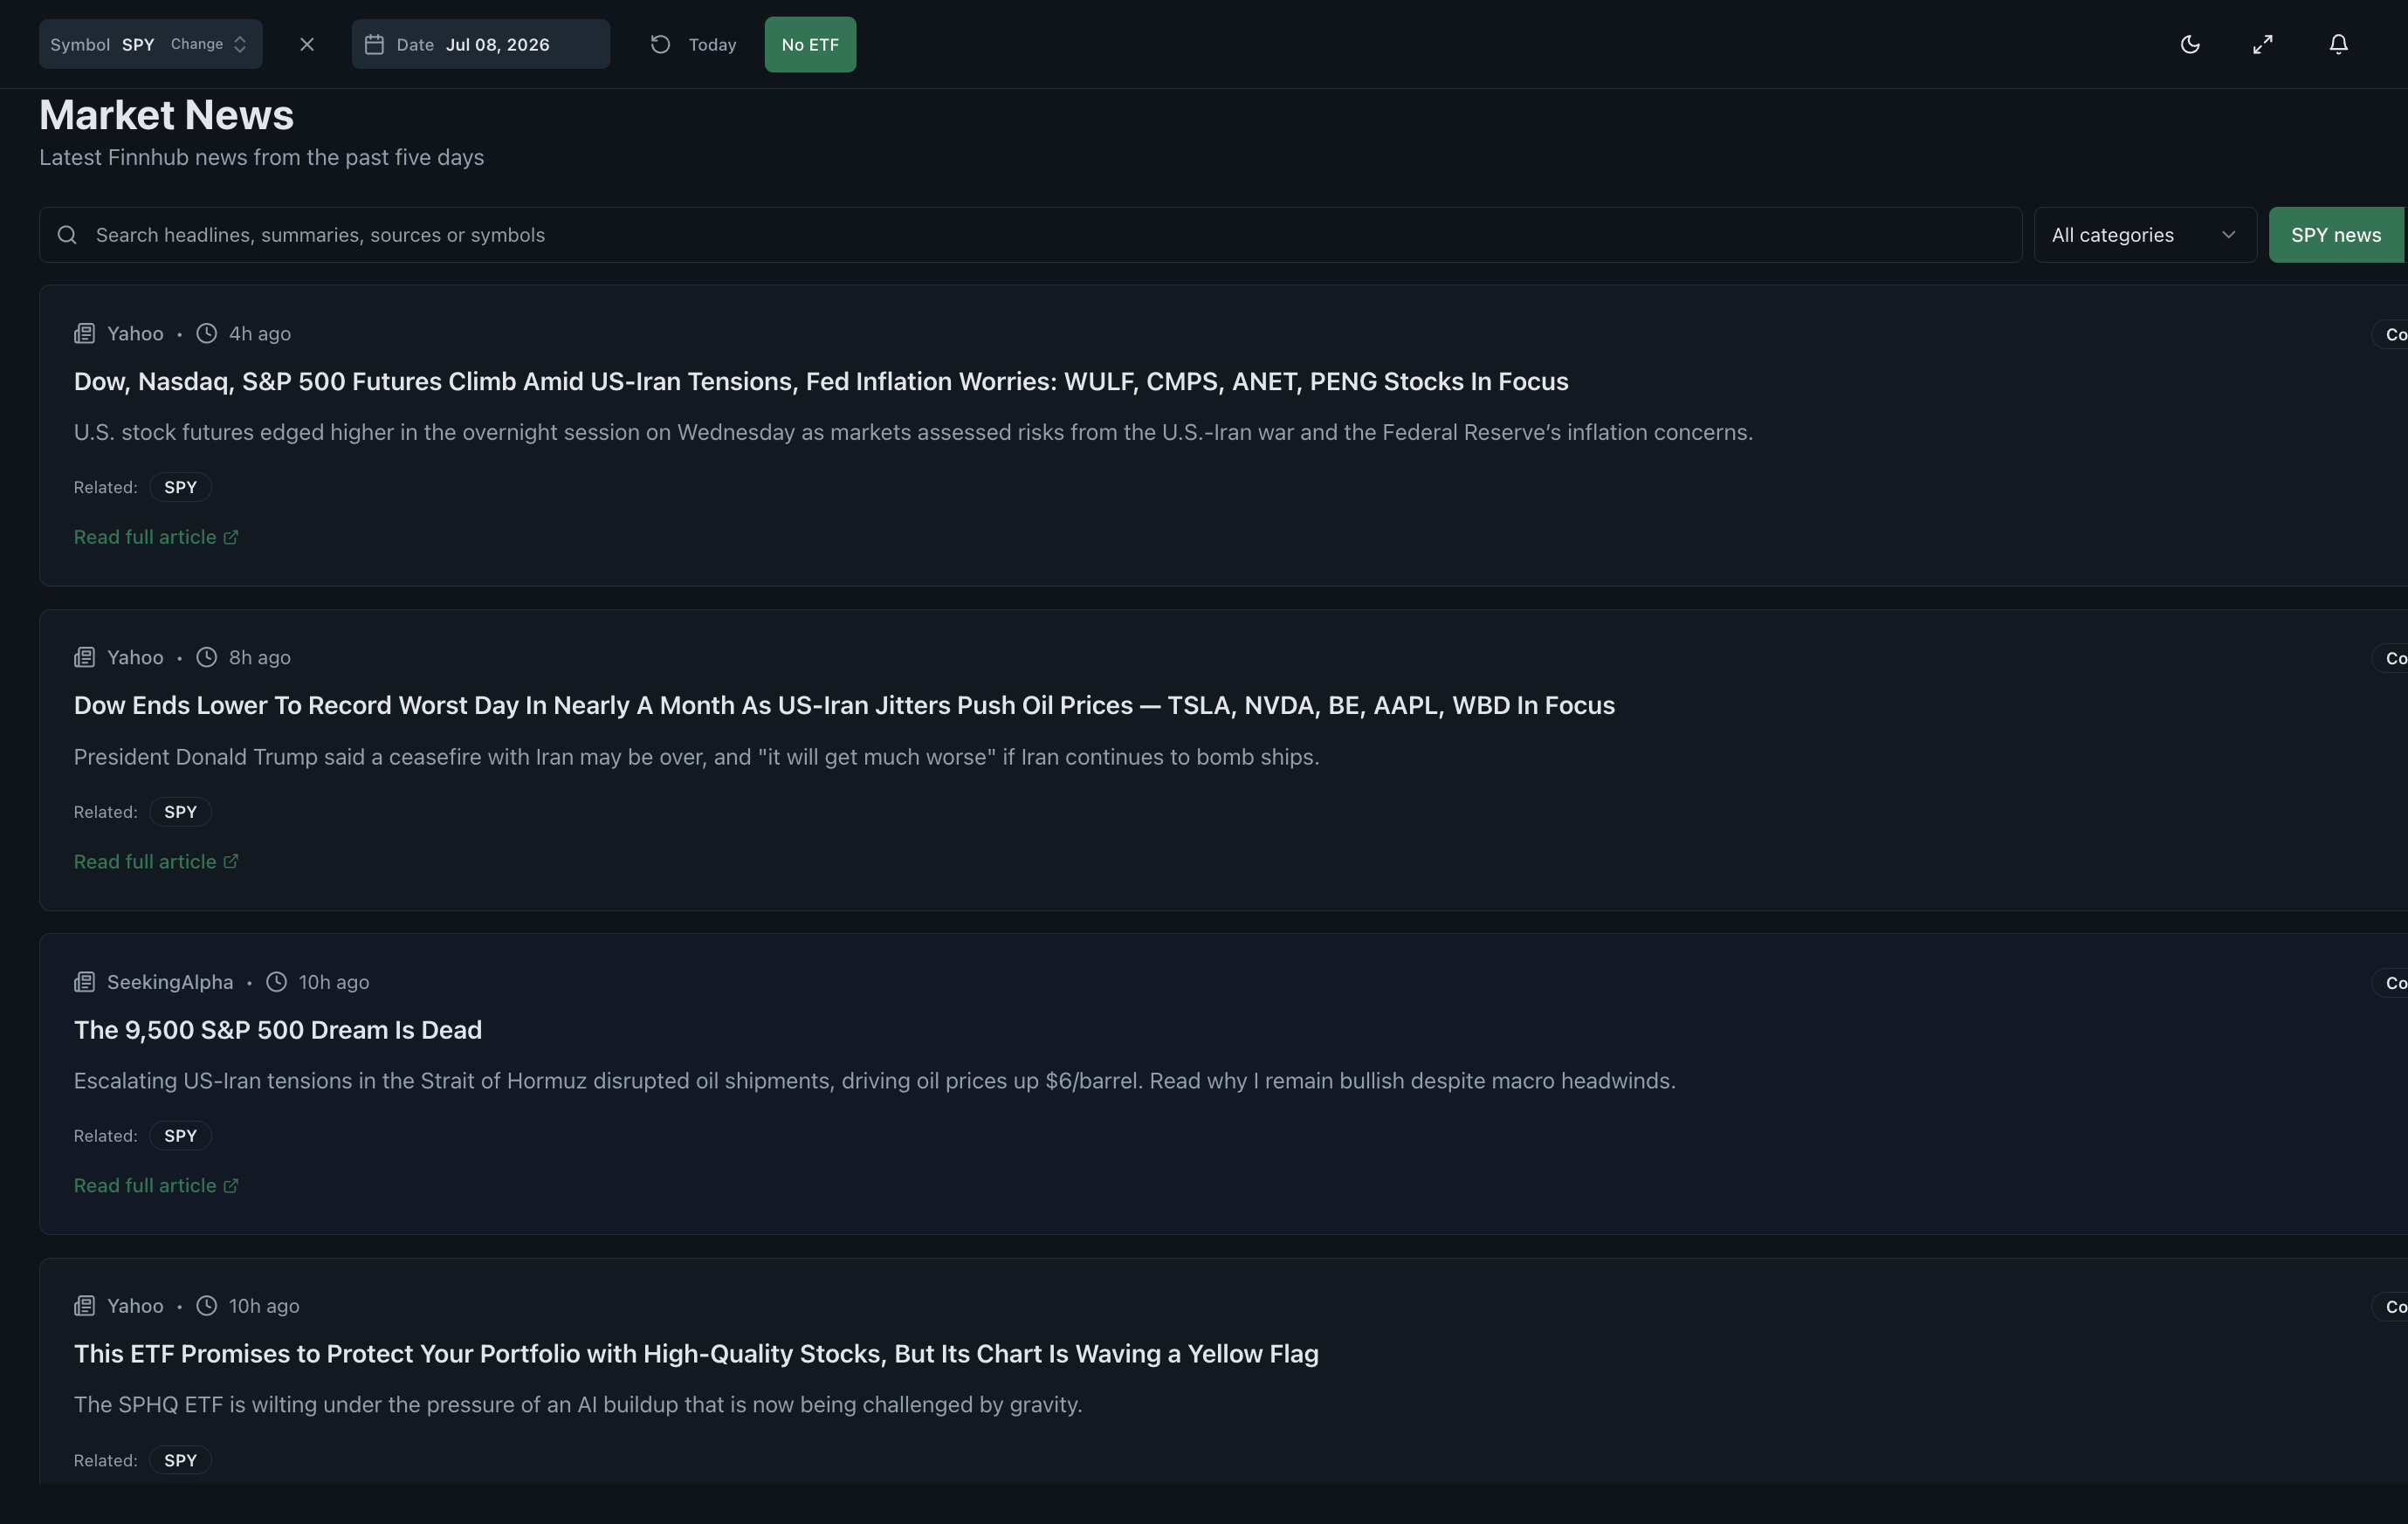
Market news page filtered to SPY headlines with search and category controls

The catalyst behind the flow

Flow without context is guesswork. The news view filters headlines by ticker and category so an unusual print can be checked against an earnings date, a downgrade or a macro release before you act on it.

  • Headlines filtered to the ticker you are researching
  • Search across sources and categories
  • Timestamps aligned with the trading session

Six of the ten research dashboards are shown in this tour. Read the breakdown of the other four tools further down this page, or check what the free trial includes.

What options trading analytics should you monitor in real time?

Call versus put pressure, net premium, volume, open interest, gamma exposure, 0DTE positioning, price confirmation, sector and ticker flow, and the news behind a move. Each dashboard below answers one of those questions, and they are meant to be read together rather than one at a time.

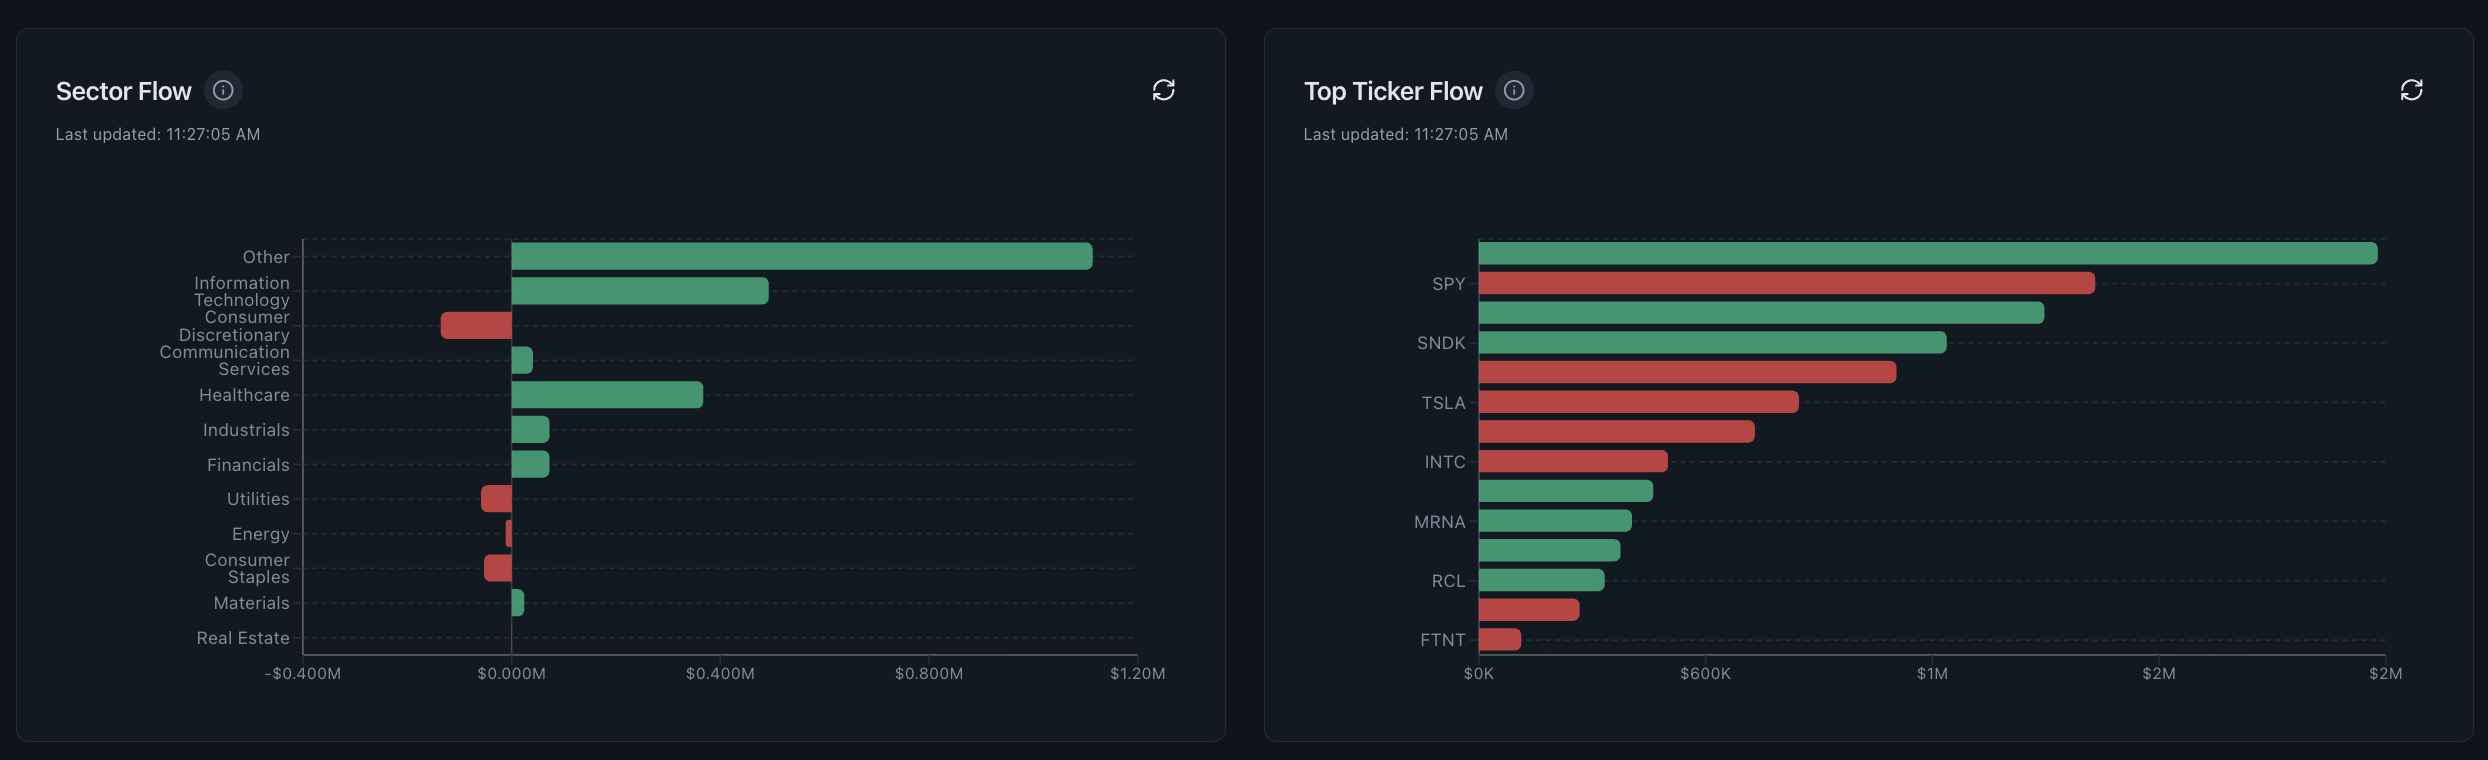
Sector flow and top ticker flow bar charts ranking bullish and bearish options premium

Sector and ticker flow

Which sectors and names are absorbing the attention?

Start from market-wide flow and drill into the sectors and single names where options premium is actually clustering, so a watchlist reflects today's activity instead of last week's.

  • Sector breadth in one bar chart
  • Top tickers ranked by net premium
  • Bullish and bearish sides split
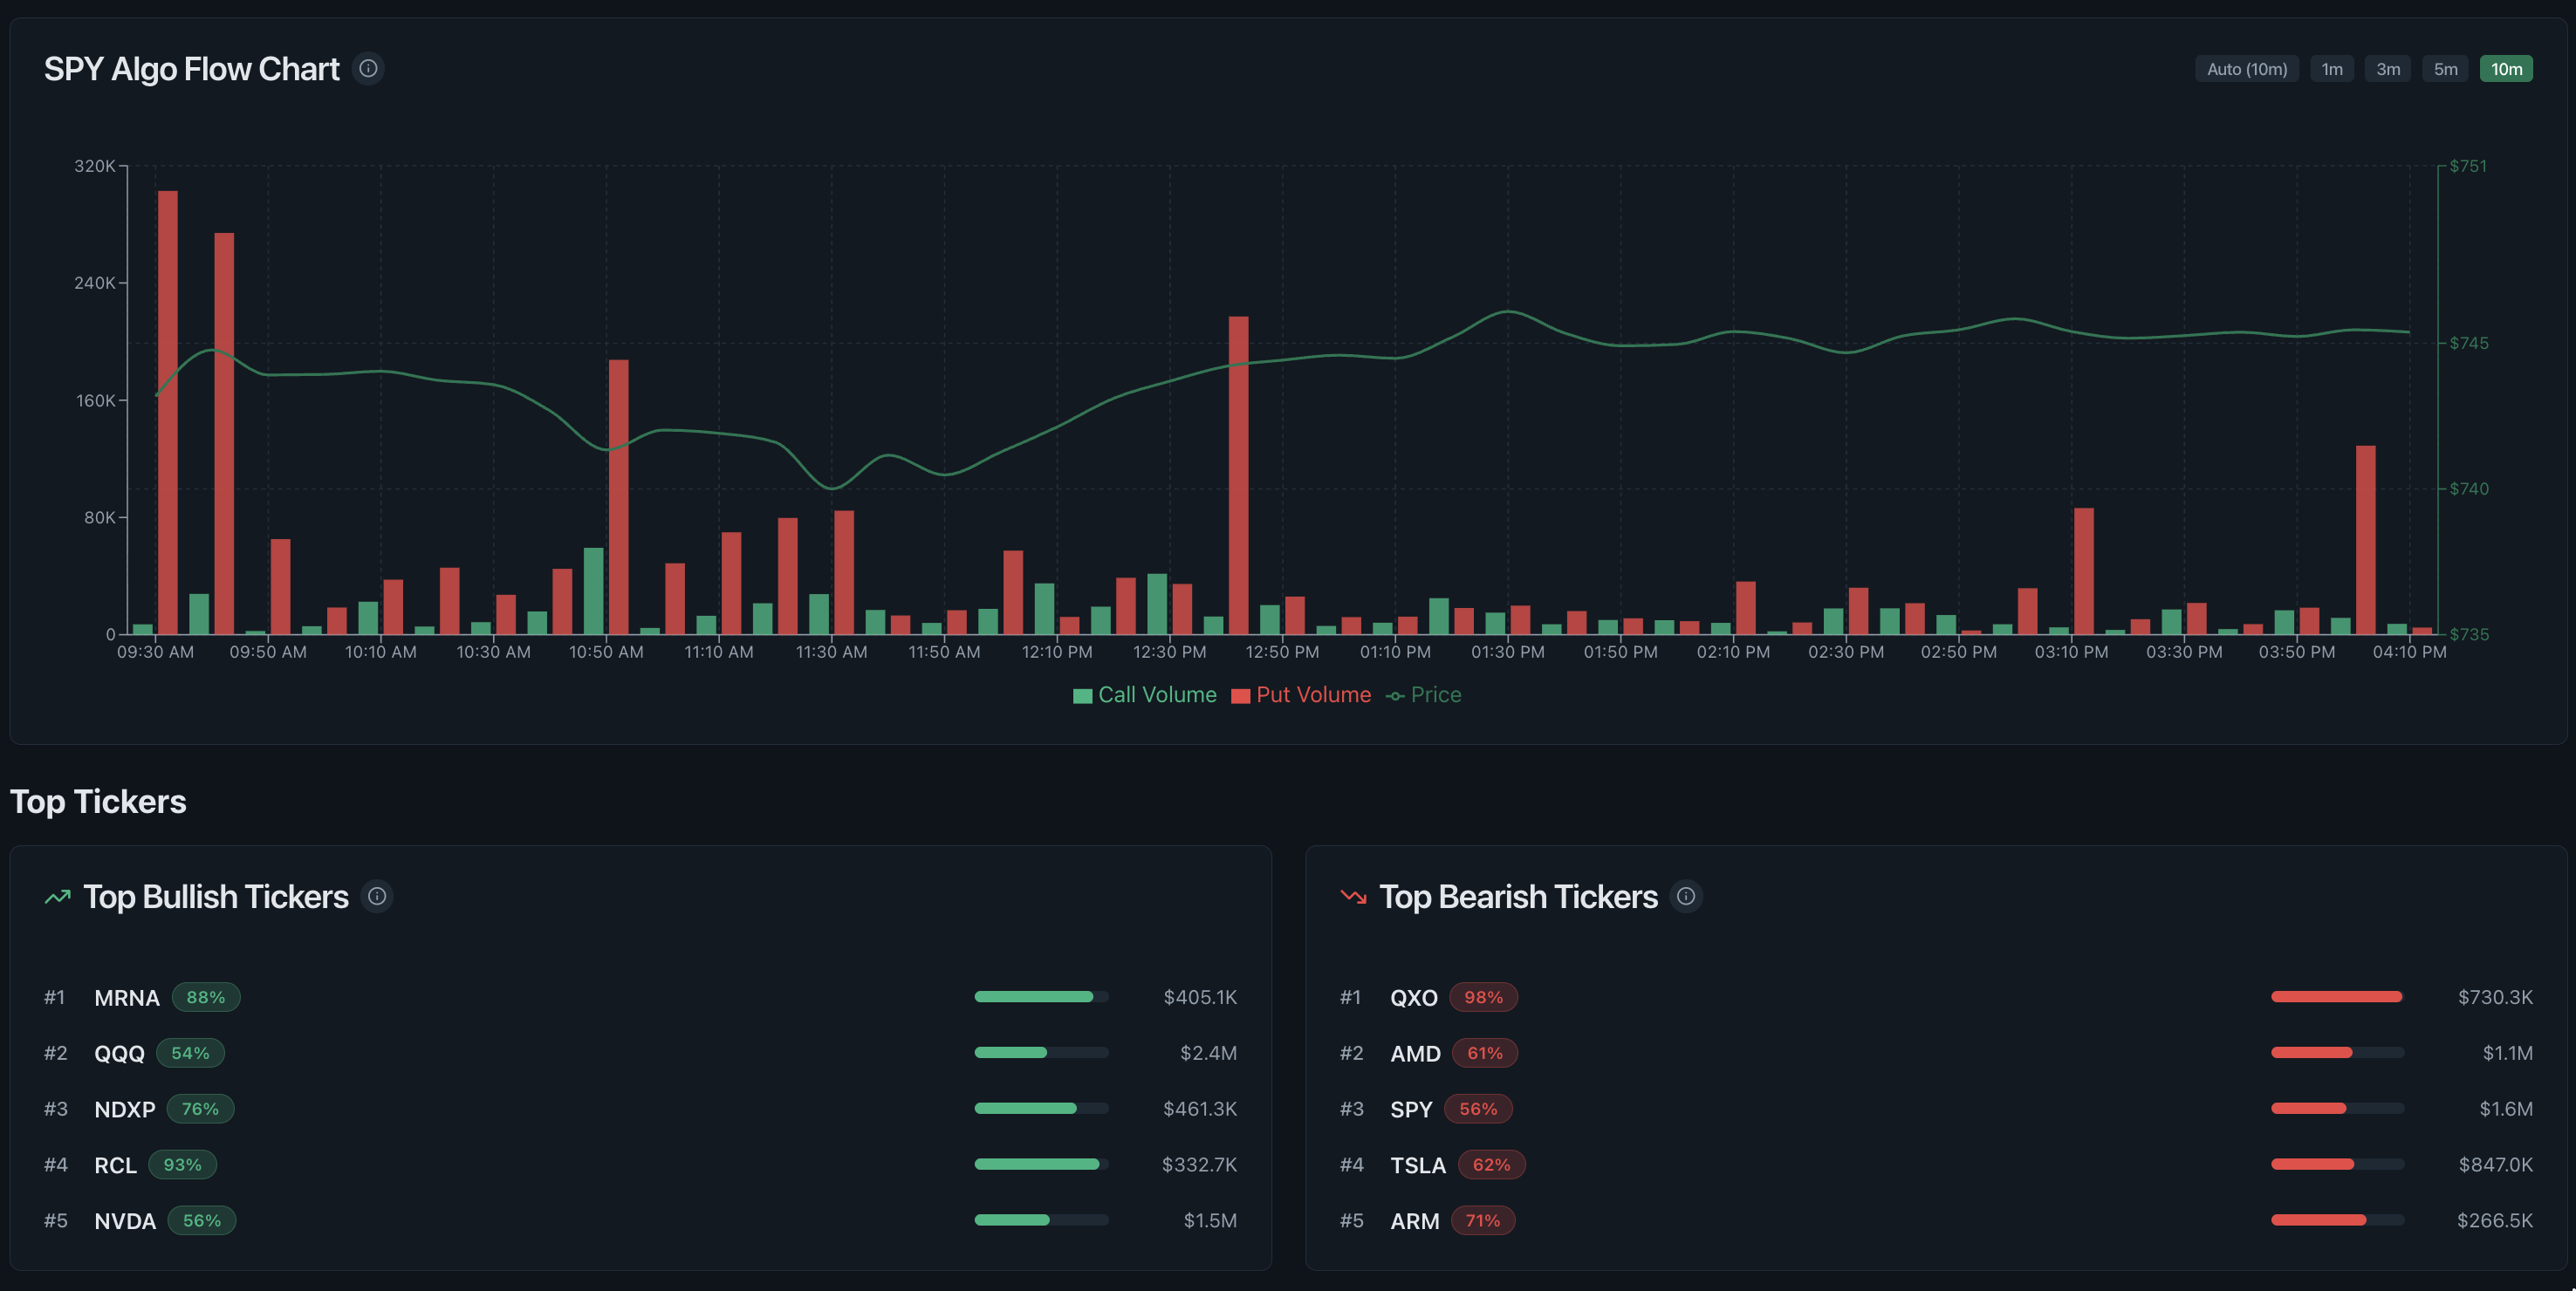
Algo flow chart with call volume, put volume and price beside top bullish and bearish tickers

Algo flow and top tickers

Which names deserve attention right now?

Call and put volume bursts sit beside a ranked list of the most active bullish and bearish tickers, which is the fastest way to decide what to research first in a busy session.

  • Call and put volume through the session
  • Price overlay for confirmation
  • Ranked bullish and bearish lists
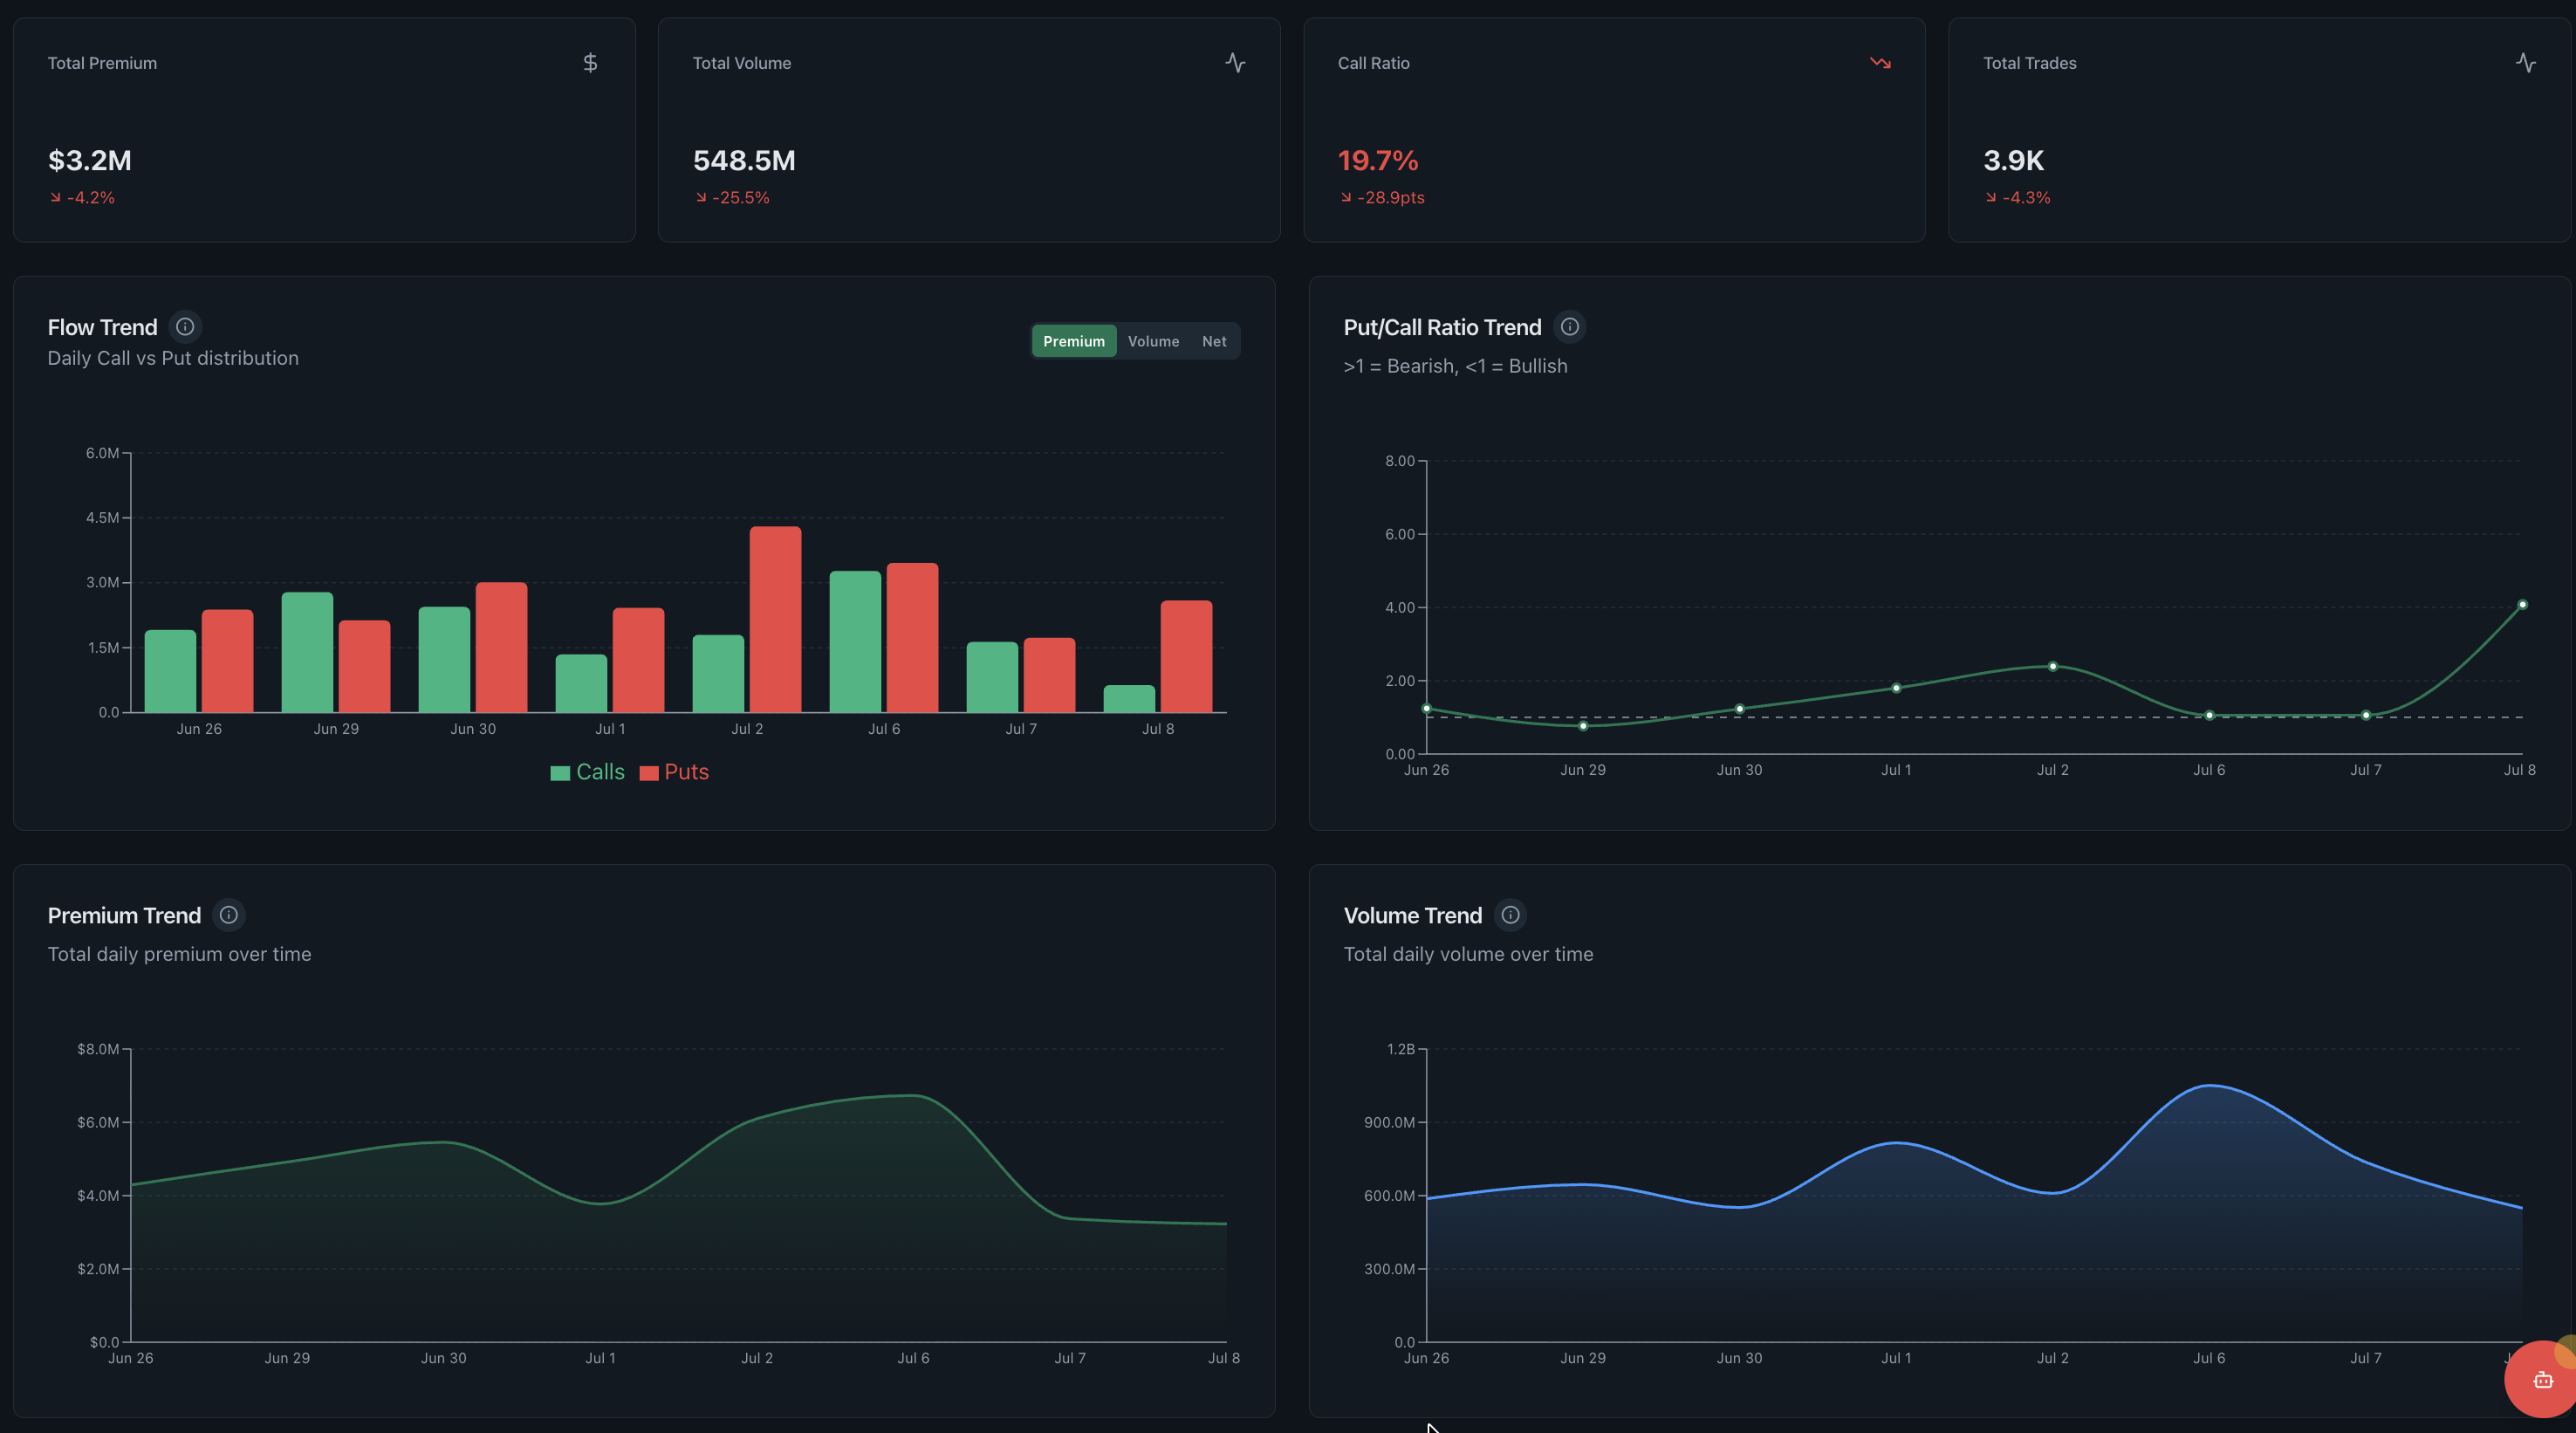
Flow trend dashboard showing total premium, volume, put call ratio and trade count over time

Flow trend dashboard

Is today part of a broader trend, or a one-off?

Total premium, volume, put/call ratio and trade count are tracked over time, so a big day can be judged against the weeks around it rather than read in isolation.

  • Premium and volume trends
  • Put/call ratio history
  • Trade count and call ratio
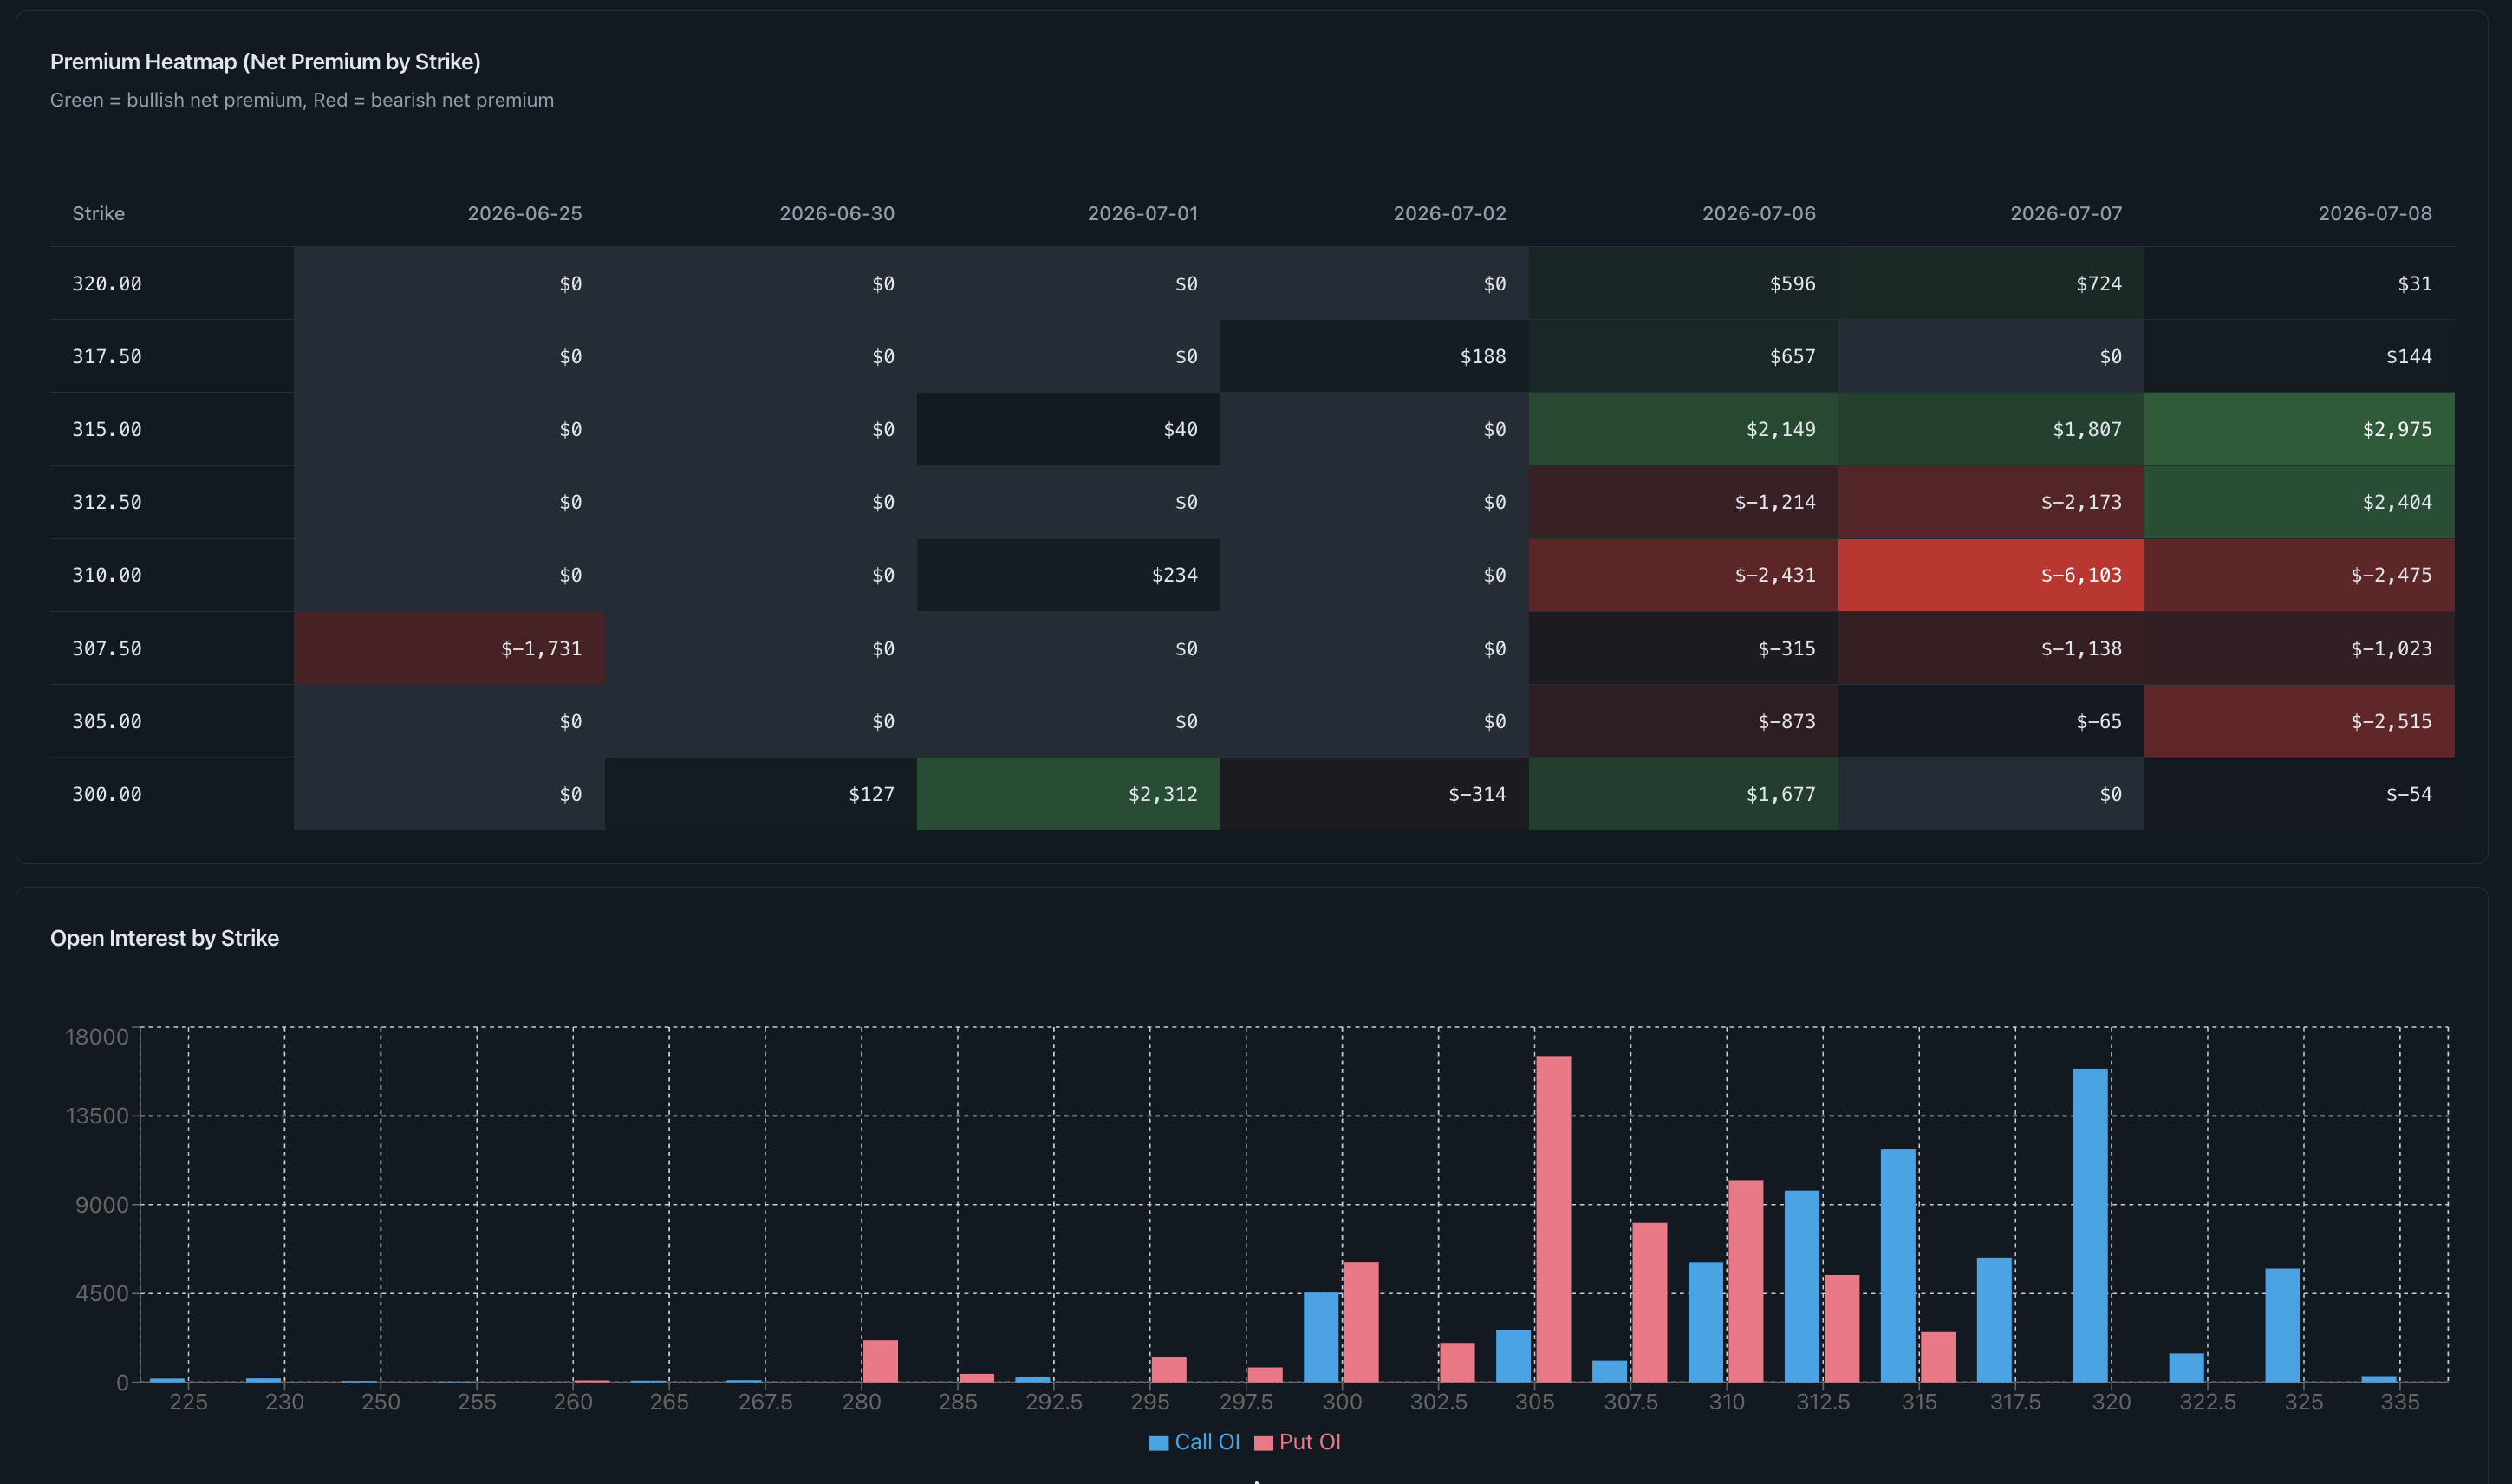
Premium heatmap by strike with call and put open interest by strike below it

Premium heatmap and open interest

Where does new premium meet existing positioning?

Net premium by strike is stacked above open interest by strike, which shows where fresh activity is landing on top of positions that are already there.

  • Net premium heatmap by strike
  • Call and put open interest
  • Strike-level option chain context

Also included in every plan

Weighted net flow

Is options pressure confirming or fighting price?

Calls, puts, sentiment and price on one intraday chart.

Premium heat grid

Which strike and expiry carries the exposure?

Premium, GEX and VEX across 0DTE and later expiries.

Flow map and Greeks by strike

Where is flow building and where does hedging matter?

Ticker tiles beside gamma, vanna and charm per strike.

0DTE and GEX

Where can same-day positioning create friction?

Scaled gamma exposure around the current price.

Whales positioning

What happened after a large contract hit the tape?

Ask, mid and bid premium with volume, open interest and price.

Market news context

What catalyst could explain the flow?

Ticker-filtered headlines with timing and source.

Screenshots of these six are in the dashboard tour above. Every dashboard listed here is part of the single $25 per month plan.

Options trading data coverage

One research dashboard for the US options market: options flow, quote context, option chains, open interest and sentiment, updated continuously through the trading day.

Options flow and market data

Near real-time options flow with sweep and block detection, unusual options activity, net premium, volume and put/call ratio trends, so you can research how aggressive money is positioning across the market.

Calls, puts and option chains

Calls and puts across every strike and expiry: option chain heatmaps, open interest by strike, Greeks including gamma, vanna and charm, plus contract-level bid, mid and ask premium context.

US stocks, ETFs and 0DTE

Thousands of US-listed stocks and ETFs including SPY and QQQ options, large caps and active single names, plus 0DTE gamma exposure analytics and futures context for ES and NQ.

Data is aggregated from licensed third-party sources and processed into analytics. It is not a direct exchange feed, and there is no public options data API. Read how the data is sourced or see the tools it feeds.

What the options flow dashboard covers

One subscription, one workflow. Everything listed here is part of the platform rather than a paid add-on.

Options flow scanner
Sweeps, blocks and large single prints across US stocks and ETFs, filterable by size, side and sentiment.
Real time options quotes context
Contract-level premium at the bid, mid and ask over time, next to price, volume and open interest.
Option chain data by strike
Premium and open interest broken out strike by strike and expiry by expiry, with Greeks per strike.
Put activity and put/call ratio
Put premium tracked separately from calls, with the ratio charted through the session and over weeks.
0DTE and gamma exposure
Same-day positioning and scaled GEX around spot, including the strike carrying the largest exposure.
Multi-ticker screening
Rank thousands of tickers by net premium, volume or unusual activity to decide what to look at first.
Market news and calendar
Ticker-filtered headlines and scheduled events so a flow spike can be matched to a catalyst.
Historical flow for research
Look back at previous sessions to check whether a pattern has shown up before and what followed it.
Configurable notifications
Get told when the data crosses a threshold you set. The platform reports activity, it never tells you to trade.
How a session on the platform actually goes

No setup calls, no integrations, no signals telling you what to buy. You get the data organised and you do the research.

  1. Step 1

    Set up your watchlist

    Pick the tickers you follow and the thresholds worth being told about. It takes a few minutes and there is nothing to install or connect.

  2. Step 2

    Watch the flow during the session

    Weighted net flow, the heat grid and the tape update continuously while US markets are open. Trial accounts see the same screens on a 15-minute delay.

  3. Step 3

    Check a signal against context

    Before acting on anything, cross-check it: strike-level exposure, open interest, the trend over recent weeks, and the news on that ticker. Then make your own call.